Categories: Technical analysis

Dow Jones Wave Analysis – 19 April, 2022

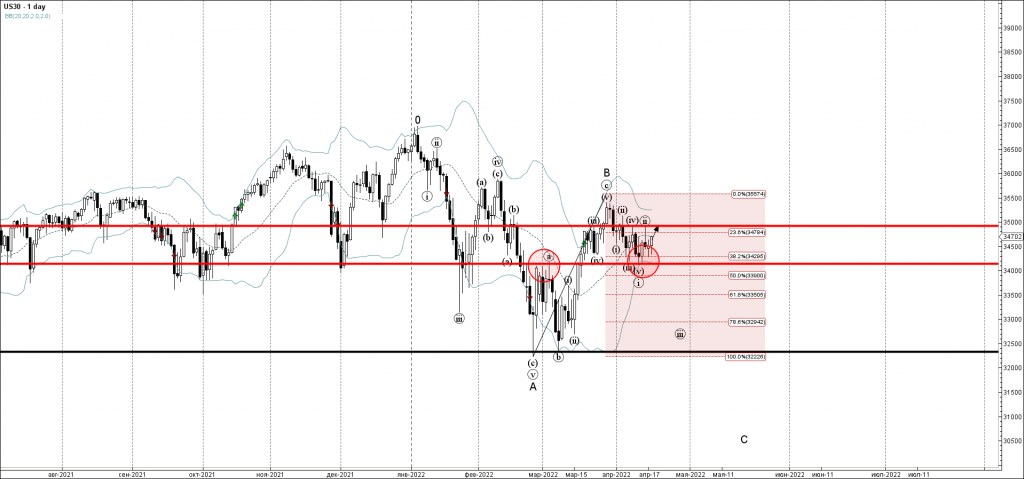
• Dow Jones reversed from support level 34140.00
• Likely to rise to resistance level 34920.00

Dow Jones recently reversed up from the support level 34140.00 (former resistance from March) intersecting with the 38.2% Fibonacci correction of the upward wave B from February.

The support zone near the support level 34140.00 was further strengthened by the lower daily Bollinger Band.

Dow Jones can be expected to rise further toward the next resistance level 34920.00 (top of the previous waves (iv) and (ii)).

The FxPro Tech Analysis Team

The FxPro technical experts prepare a daily analysis of the most active currency pairs (majors, crosses, exotics) and commodities. Selected instruments are reviewed on daily trends (D1, H4), using the active Elliott Wave setups, Japanese candlesticks, indicators, and support/resistance levels.

Share
Published by
The FxPro Tech Analysis Team
Tags: Dow Jones

Recent Posts

USDJPY Wave Analysis 26 April 2024

- USDJPY broke key resistance level 155.00 - Likely to rise to resistance level 160.00…

2 days ago

Ebay Wave Analysis 26 April 2024

- Ebay reversed from support level 49.35 - Likely to rise to resistance level 52.55…

2 days ago

False Alert with Yen Interventions?

Even though the Bank of Japan left the key rate and parameters of the QE…

3 days ago

Cooler Bitcoin

Market picture  Market Dynamics: The cryptocurrency market stabilised, losing just 0.1% of capitalisation and dropping to…

3 days ago

GBPCAD Wave Analysis 25 April 2024

- GBPCAD reversed from key support level 1.6910 - Likely to rise to resistance level…

4 days ago

GBPAUD Wave Analysis 25 April 2024

- GBPAUD reversed from support level 1.9135 - Likely to rise to resistance level 1.9360…

4 days ago

This website uses cookies