Categories: Technical analysis

Dow Jones Wave Analysis – 16 March 2023

• Dow Jones reversed from support level 31800.00

• Likely to rise to resistance level 32500.00

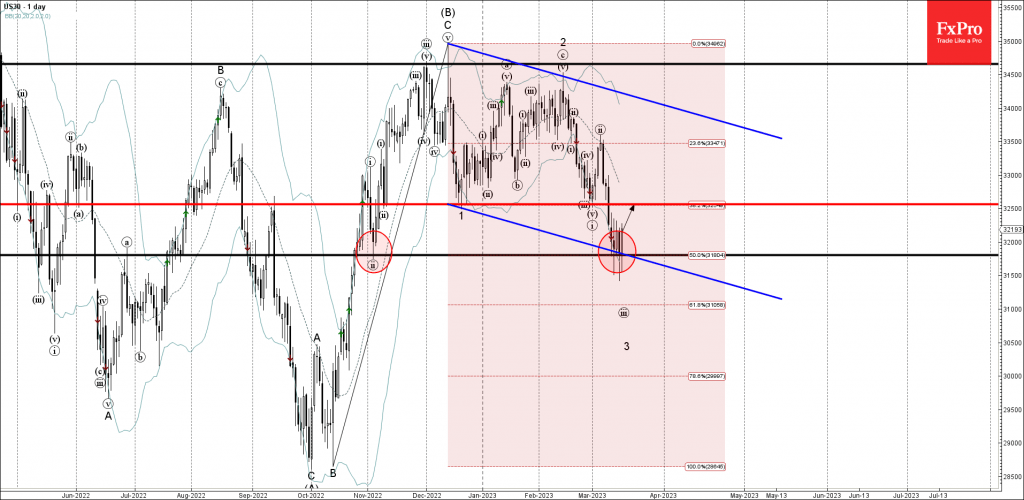
Dow Jones recently reversed up from the key support level 31800.00 (previous monthly low from November) intersecting with the lower daily Bollinger Band.

The support level 31800.00 was further strengthened by the support trendline of the wide down channel from December and the 50% Fibonacci correction of the upward impulse from October.

Dow Jones can be expected to rise further toward the next resistance level 32500.00 (former monthly low from December and February).

The FxPro Tech Analysis Team

The FxPro technical experts prepare a daily analysis of the most active currency pairs (majors, crosses, exotics) and commodities. Selected instruments are reviewed on daily trends (D1, H4), using the active Elliott Wave setups, Japanese candlesticks, indicators, and support/resistance levels.

Share
Published by
The FxPro Tech Analysis Team
Tags: Dow Jones

Recent Posts

S&P 500 Wave Analysis 7 May 2024

- S&P 500 reversed from support level 5000.00 - Likely to rise to resistance level…

10 hours ago

USDCHF Wave Analysis 7 May 2024

- USDCHF reversed from support zone - Likely to rise to resistance level 0.9200 USDCHF…

10 hours ago

EURUSD at the equilibrium, where will it go next?

The single currency is trading near $1.076, waiting for further cues and facing serious resistance…

15 hours ago

Bitcoin can’t accelerate but won’t give up trying

Market picture  The crypto market capitalisation fell by 1.7% in 24 hours to $2.29 trillion,…

20 hours ago

USDJPY Wave Analysis 6 May 2024

- USDJPY reversed from support zone - Likely to rise to resistance level 155.65 USDJPY…

1 day ago

Gold Wave Analysis 6 May 2024

- Gold reversed from support zone - Likely to rise to resistance level 2400.00 Gold…

1 day ago

This website uses cookies