Categories: Technical analysis

Dow Jones Wave Analysis – 14 October, 2022

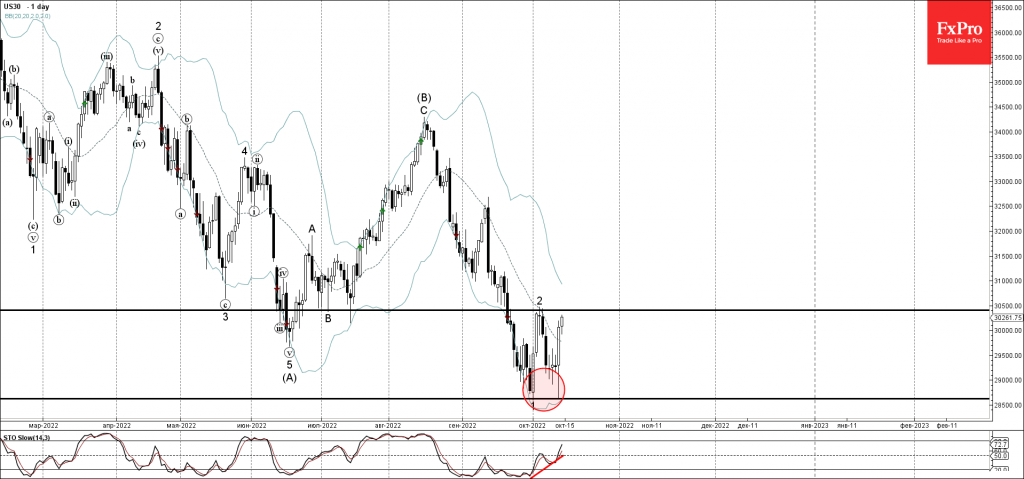
• Dow Jones reversed from support level 28620.00

• Likely to rise to resistance level 30500.00

Dow Jones index recently reversed up from the key support level 28620.00 (which stopped the previous short-term impulse wave 1), intersecting with the lower daily Bollinger Band.

The upward reversal from the support level 28620.00 stopped the earlier impulse wave 3, which belongs to the intermediate impulse wave (C) from April.

Given the bullish divergence on the daily Stochastic, Dow Jones index can be expected to rise toward the next resistance level 30500.00 (top of the previous wave 2).

The FxPro Tech Analysis Team

The FxPro technical experts prepare a daily analysis of the most active currency pairs (majors, crosses, exotics) and commodities. Selected instruments are reviewed on daily trends (D1, H4), using the active Elliott Wave setups, Japanese candlesticks, indicators, and support/resistance levels.

Share
Published by
The FxPro Tech Analysis Team
Tags: Dow Jones

Recent Posts

EURUSD at the equilibrium, where will it go next? 

The single currency is trading near $1.076, waiting for further cues and facing serious resistance…

3 hours ago

Bitcoin can’t accelerate but won’t give up trying

Market picture  The crypto market capitalisation fell by 1.7% in 24 hours to $2.29 trillion,…

8 hours ago

USDJPY Wave Analysis 6 May 2024

- USDJPY reversed from support zone - Likely to rise to resistance level 155.65 USDJPY…

23 hours ago

Gold Wave Analysis 6 May 2024

- Gold reversed from support zone - Likely to rise to resistance level 2400.00 Gold…

23 hours ago

Oil Bounces Locally, Global Support 5% below Spot Price

The number of operating oil rigs in the US fell by 7 to 499. This…

1 day ago

Crypto Market Tries to Break Local Downtrend

Market picture  Crypto market capitalisation has been up 2% over the past seven days and…

1 day ago

This website uses cookies