Categories: Technical analysis

Dow Jones Wave Analysis 11 November 2024

– Dow Jones rising inside impulse wave 5

– Likely to reach resistance level 45000.00

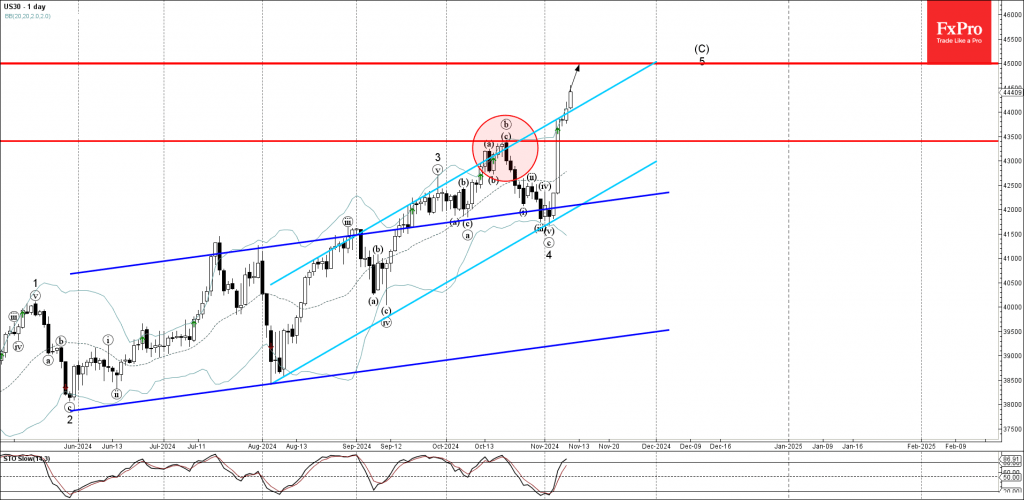
Dow Jones index continues to rise inside the minor impulse wave 5, which previously broke the key resistance level 43500.00 and the resistance trendline of the daily up channel from August.

The active impulse wave 5 belongs to the weekly upward impulse sequence (C) from April of this year.

Given the clear weekly uptrend, Dow Jones index can be expected to rise to the next resistance level 45000.00 (target price for the completion of the active impulse wave 5).

The FxPro Tech Analysis Team

The FxPro technical experts prepare a daily analysis of the most active currency pairs (majors, crosses, exotics) and commodities. Selected instruments are reviewed on daily trends (D1, H4), using the active Elliott Wave setups, Japanese candlesticks, indicators, and support/resistance levels.

Share
Published by
The FxPro Tech Analysis Team
Tags: Dow Jones

Recent Posts

Do not underestimate dollar

Positive macro statistics for the US are helping the greenback. Gold could rise to $4,610…

2 hours ago

Crypto fails to find support for a breakout

Crypto markets fell amid caution; Bitcoin and Ethereum face technical and investor shifts, with privacy…

3 hours ago

SP500. Current situation #sp500 #tradelikeapro #trading #trandingshorts #tradingstrategy #fxpro

Today is Thursday, January 8th, and we continue talking about the markets. Today, we will…

4 hours ago

NZDCAD Wave Analysis – 7 January 2026

NZDCAD: ⬆️ Buy - NZDCAD reversed from support zone - Likely to rise to resistance…

17 hours ago

Bitcoin Wave Analysis – 7 January 2026

Bitcoin: ⬇️ Sell - Bitcoin reversed from resistance zone - Likely to fall to support…

17 hours ago

EURGBP Wave Analysis – 7 January 2026

EURGBP: ⬆️ Buy - EURGBP reversed from support zone - Likely to rise to resistance…

17 hours ago

This website uses cookies