Categories: Technical analysis

Dow Jones Wave Analysis – 10 January, 2022

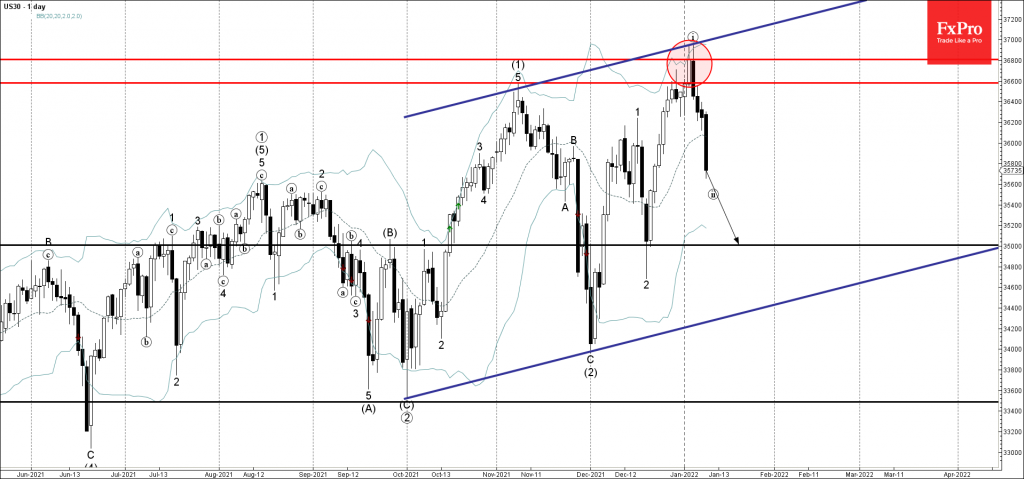
• Dow Jones reversed from resistance level 36800.00,

• Likely to fall to support level 35000.00

Dow Jones index recently reversed down with the daily bearish Engulfing from the resistance level 36800.00, intersecting with the upper daily Bollinger Band and the weekly up channel from September.

The downward reversal from the resistance level 36800.00 started the active short-term corrective wave (ii).

Dow Jones index can be expected to fall further toward the next key support level 35000.00 (which reversed the price in December).

The FxPro Tech Analysis Team

The FxPro technical experts prepare a daily analysis of the most active currency pairs (majors, crosses, exotics) and commodities. Selected instruments are reviewed on daily trends (D1, H4), using the active Elliott Wave setups, Japanese candlesticks, indicators, and support/resistance levels.

Share
Published by
The FxPro Tech Analysis Team
Tags: Dow Jones

Recent Posts

Pro News Flash: Bitcoin Is Stuck While Billion Dollar Buyers Step In

🛟 Bitcoin is having a hard time staying afloat, even as major players step in…

3 hours ago

Natural Gas. Current situation #trandingshorts #tradelikeapro #trading #tradingstrategy #naturalgas

We're gonna talk about the gas market, where prices are falling rapidly. Let's take a…

5 hours ago

The dollar remains focused on the labour market

The US dollar weakened significantly in 2025, and its fate depends on central banks. The…

5 hours ago

Major coins dragged the market down

Major cryptocurrencies fell amid declining market sentiment, low liquidity, and institutional rebalancing, with Bitcoin dropping…

7 hours ago

Dogecoin Wave Analysis – 15 December 2025

Dogecoin: ⬇️ Sell - Dogecoin broke long-term support level 0.1365 - Likely to fall to…

20 hours ago

Alcoa Wave Analysis – 15 December 2025

Alcoa: ⬇️ Sell - Alcoa reversed from strong resistance level 47.00 - Likely to fall to…

20 hours ago

This website uses cookies