Categories: Technical analysis

Dow Jones Industrial Average Wave Analysis – 2 October, 2019

  • Dow Jones reversed from resistance area
  • Likely to rise to 1557.00

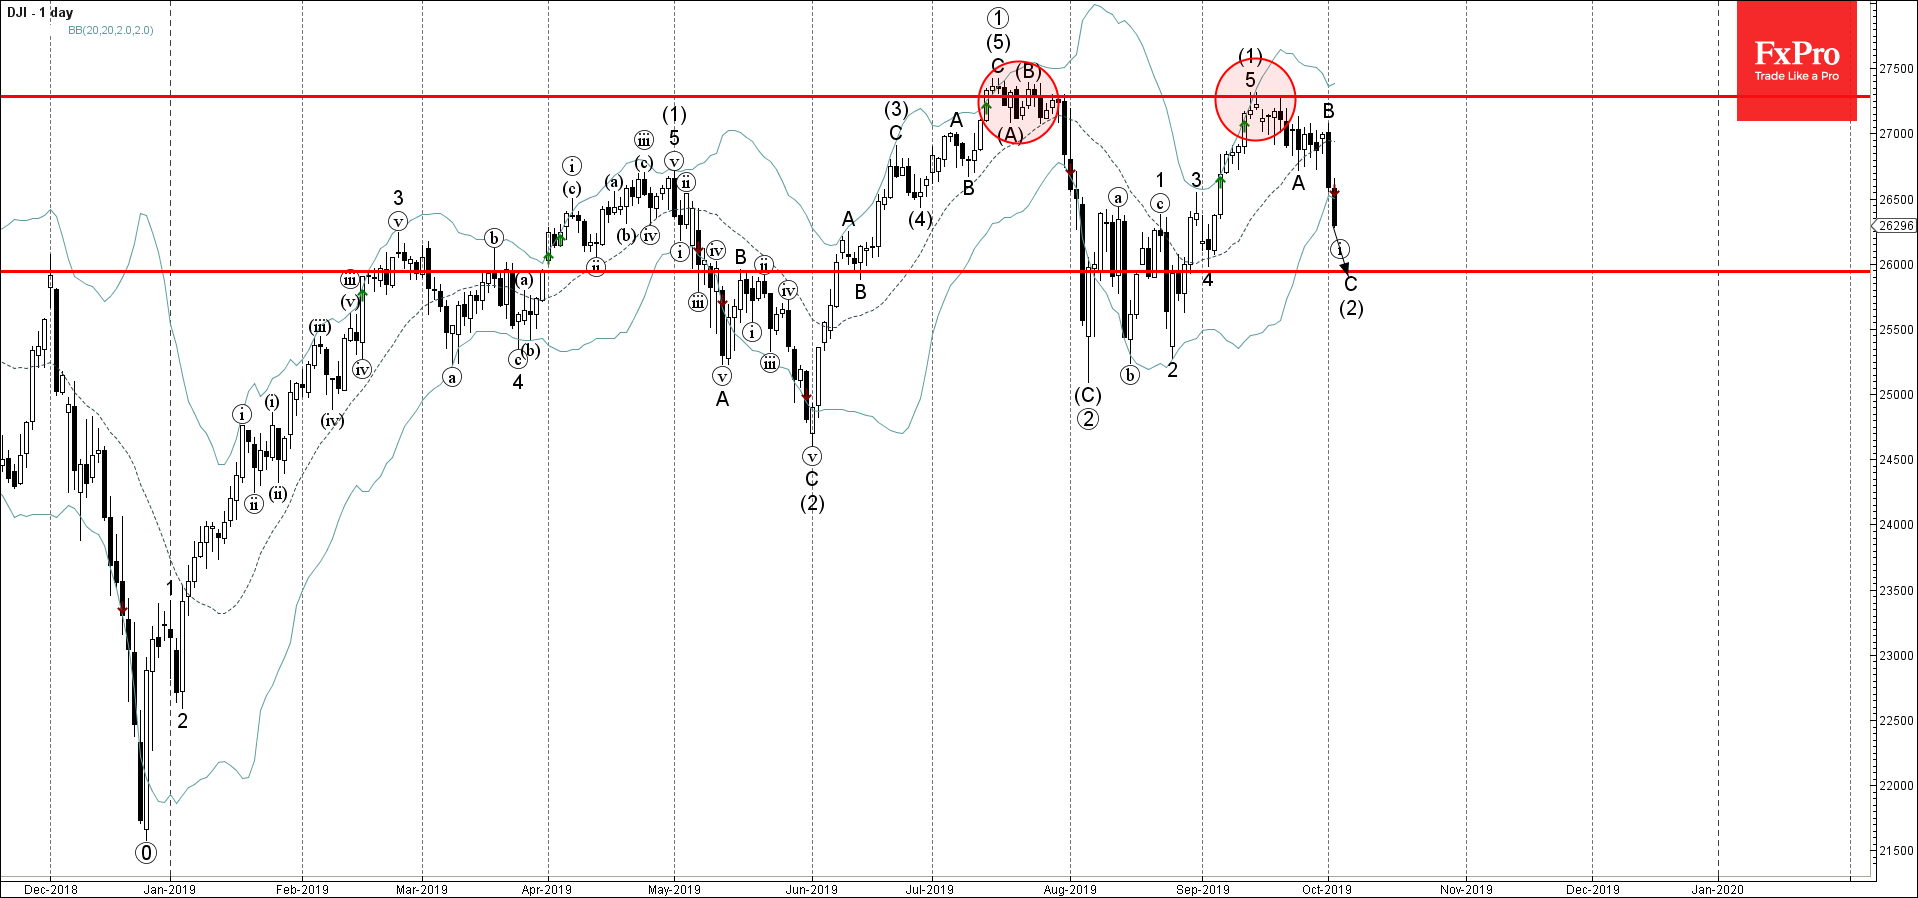
Dow Jones continues to fall inside the C-wave of the medium-term ABC correction (2) which started earlier from the resistance area lying between the resistance level 27300.00 (former monthly top from July) and the upper daily Bollinger Band.

The aforementioned resistance level 27300.00 stopped the extended uptrend which started at the end of 2018.

Dow Jones is expected to fall further and retest the next support level 26000.00 (likely price for the completion of the active ABC correction (2)).

AddThis Website Tools
The FxPro Tech Analysis Team

The FxPro technical experts prepare a daily analysis of the most active currency pairs (majors, crosses, exotics) and commodities. Selected instruments are reviewed on daily trends (D1, H4), using the active Elliott Wave setups, Japanese candlesticks, indicators, and support/resistance levels.

Share
Published by
The FxPro Tech Analysis Team
Tags: dji

Recent Posts

Tesla Wave Analysis – 21 March 2025

Tesla: ⬆️ Buy - Tesla reversed from support level 220.00 - Likely to rise to…

24 hours ago

Google Wave Analysis – 21 March 2025

Google: ⬆️ Buy - Google reversed from key support level 160.00 - Likely to rise…

24 hours ago

Silver Wave Analysis – 21 March 2025

Silver: ⬇️ Sell - Silver reversed from resistance level 34.00 - Likely to fall to…

1 day ago

USDCHF Wave Analysis – 21 March 2025

USDCHF: ⬆️ Buy - USDCHF reversed from support level 0,8750 - Likely to fall to…

1 day ago

What’s next: Flash PMIs, UK CPI & US PCE

The week ahead includes the release of the PMI business activity indexes for March, the…

1 day ago

Gold: Growth Opportunities

Gold has been in an uptrend, reaching record highs and offering growth opportunities. However, caution…

1 day ago