Categories: Technical analysis

Dow Jones Index Wave Analysis – 4 September 2025

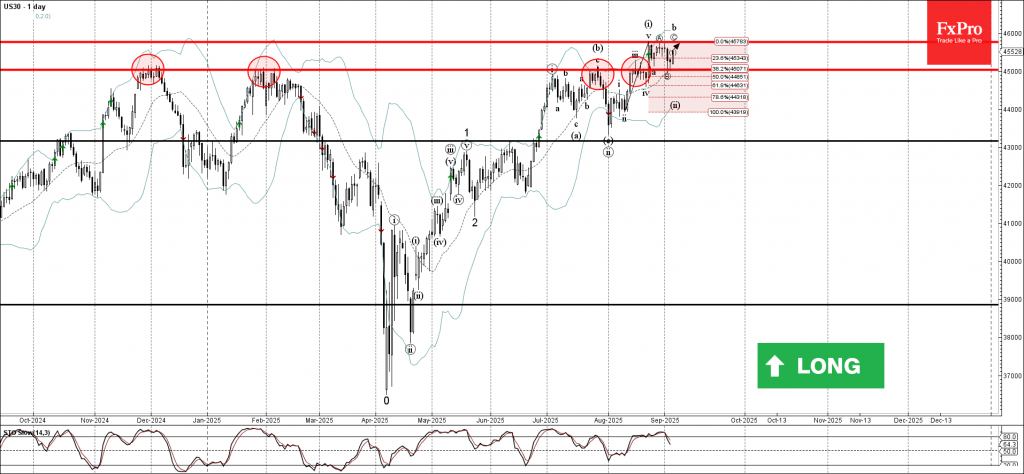
Dow Jones Index: ⬆️ Buy

– Dow Jones Index reversed from key support level 45000.00

– Likely to rise to resistance level 45765.00

Dow Jones Index recently reversed from the support area between the key support level 45000.00 (former strong resistance, which has been reversing the price from the end of 2024), 20-day moving average and the 38.2% Fibonacci correction of the upward impulse from August.

The upward reversal from this support area stopped the previous short-term correction ii.

Given the strong daily uptrend, Dow Jones Index can be expected to rise to the next resistance level 45765.00 (which reversed the Index in August).

The FxPro Tech Analysis Team

The FxPro technical experts prepare a daily analysis of the most active currency pairs (majors, crosses, exotics) and commodities. Selected instruments are reviewed on daily trends (D1, H4), using the active Elliott Wave setups, Japanese candlesticks, indicators, and support/resistance levels.

Share
Published by
The FxPro Tech Analysis Team
Tags: Dow Jones

Recent Posts

CHFJPY Wave Analysis – 9 January 2026

CHFJPY: ⬆️ Buy - CHFJPY reversed from support area - Likely to rise to resistance…

15 hours ago

Exxon Mobil Wave Analysis – 9 January 2026

Exxon Mobil: ⬆️ Buy - Exxon Mobil reversed from support area - Likely to rise…

15 hours ago

Pro News Weekly: Dollar Rebounds as Markets Test New Limits

Welcome to Pro News Weekly! Here’s what is shaping the markets: 💵 The U.S. dollar…

19 hours ago

Geopolitics will destroy the euro

•    EURUSD falls due to geopolitics and expectations of tariff removal •    Gold returns to…

1 day ago

Platinum Wave Analysis – 8 January 2026

Platinum: ⬇️ Sell - Platinum reversed from pivotal resistance level 150.00 - Likely to fall to…

2 days ago

Baidu Wave Analysis – 8 January 2026

Baidu: ⬇️ Sell - Baidu reversed from resistance zone - Likely to fall to support level…

2 days ago

This website uses cookies