Categories: Technical analysis

Dow Jones index Wave Analysis 25 September 2023

– Dow Jones index broke key support level 34000.00

– Likely to fall to support level 33500.00

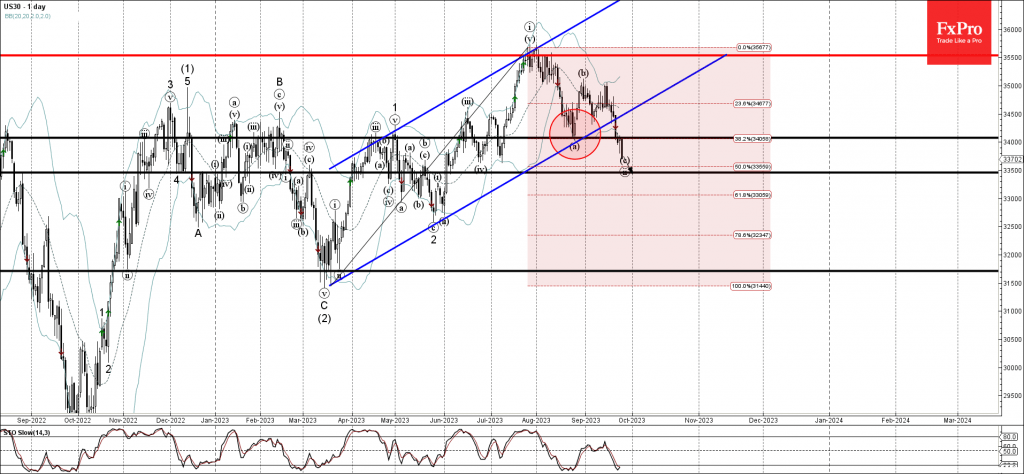
Dow Jones index recently broke key support level 34000.00 (low of the previous wave a) intersecting with the 38.2% Fibonacci correction of the previous upward impulse from March.

The breakout of the support level 34000.00 was preceded by the breakout of the daily up channel from March – which accelerated the active wave ii.

Dow Jones index can be expected to fall further toward the next support level 33500.00, target for the completion of the active wave ii.

The FxPro Tech Analysis Team

The FxPro technical experts prepare a daily analysis of the most active currency pairs (majors, crosses, exotics) and commodities. Selected instruments are reviewed on daily trends (D1, H4), using the active Elliott Wave setups, Japanese candlesticks, indicators, and support/resistance levels.

Share
Published by
The FxPro Tech Analysis Team
Tags: Dow

Recent Posts

ECB, BoE, and BoJ take different paths

Trump pushes for more Fed rate cuts, while no changes are expected from the ECB…

3 hours ago

Crypto Market Holds at $3T Amid Broken Uptrend

Crypto market stays near $3T amid correction, ETF inflows rise, sentiment weakens, and volatility expected…

4 hours ago

Gold Wave Analysis – 12 December 2025

Gold: ⬇️ Sell - Gold reversed from strong resistance level 4350.00 - Likely to fall to…

3 days ago

EURGBP Wave Analysis – 12 December 2025

EURGBP: ⬆️ Buy - EURGBP reversed from support zone - Likely to rise to resistance level…

3 days ago

Filecoin Wave Analysis – 12 December 2025

Filecoin: ⬇️ Sell - Filecoin broke key support level 1.435 - Likely to fall to support…

3 days ago

Ethereum Wave Analysis – 12 December 2025

Ethereum: ⬇️ Sell - Ethereum reversed from resistance level 3400.00 - Likely to fall to support…

3 days ago

This website uses cookies