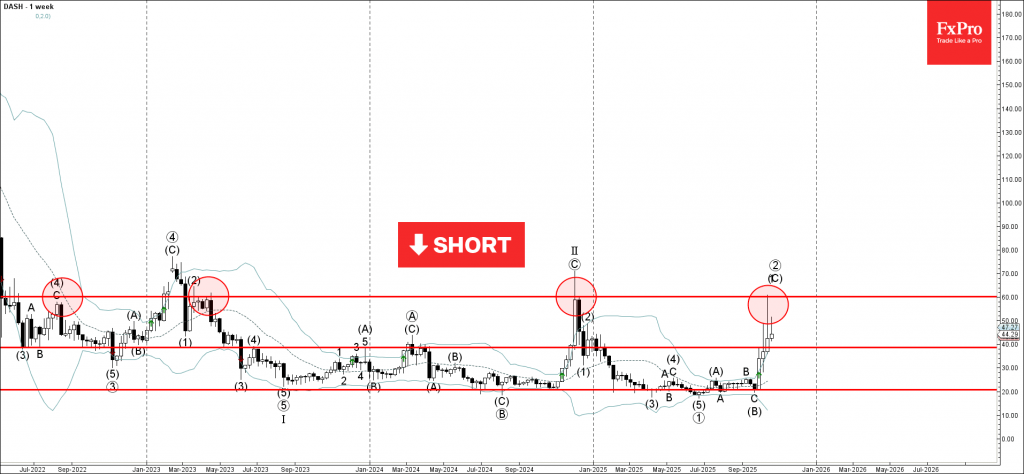
Categories: Technical analysis

Dash Wave Analysis – 21 October 2025

Dash: ⬇️ Sell

– Dash reversed from resistance level 60.00

– Likely to fall to support level 40.00

Dash cryptocurrency recently reversed down from the strong resistance level 60.00 (which has been repeatedly reversing the pair from the middle of 2022) – standing well above the upper weekly Bollinger Band.

The downward reversal from the resistance level 60.00 formed the weekly Japanese candlesticks reversal pattern Shooting Star – strong sell signal for Dash.

Given the bearish sentiment across the cryptocurrency markets today, Dash can be expected to fall to the next round support level 40.00.

The FxPro Tech Analysis Team

The FxPro technical experts prepare a daily analysis of the most active currency pairs (majors, crosses, exotics) and commodities. Selected instruments are reviewed on daily trends (D1, H4), using the active Elliott Wave setups, Japanese candlesticks, indicators, and support/resistance levels.

Share
Published by
The FxPro Tech Analysis Team
Tags: Dash

Recent Posts

NZDCAD Wave Analysis – 7 January 2026

NZDCAD: ⬆️ Buy - NZDCAD reversed from support zone - Likely to rise to resistance…

4 hours ago

Bitcoin Wave Analysis – 7 January 2026

Bitcoin: ⬇️ Sell - Bitcoin reversed from resistance zone - Likely to fall to support…

4 hours ago

EURGBP Wave Analysis – 7 January 2026

EURGBP: ⬆️ Buy - EURGBP reversed from support zone - Likely to rise to resistance…

4 hours ago

Brent Crude Oil Wave Analysis – 7 January 2026

Brent Crude Oil: ⬇️ Sell - Brent Crude Oil reversed from resistance zone - Likely…

4 hours ago

Old fears about the euro have returned

The resurgence of the political crisis in France is weighing on EURUSD The US dollar…

13 hours ago

The crypto market has hit the upper limit of its rebound

The crypto market faces resistance at $3.2T; sentiment rises, but selling pressure persists. Bitcoin and…

15 hours ago

This website uses cookies