Categories: Technical analysis

Cotton Wave Analysis 8 April, 2021

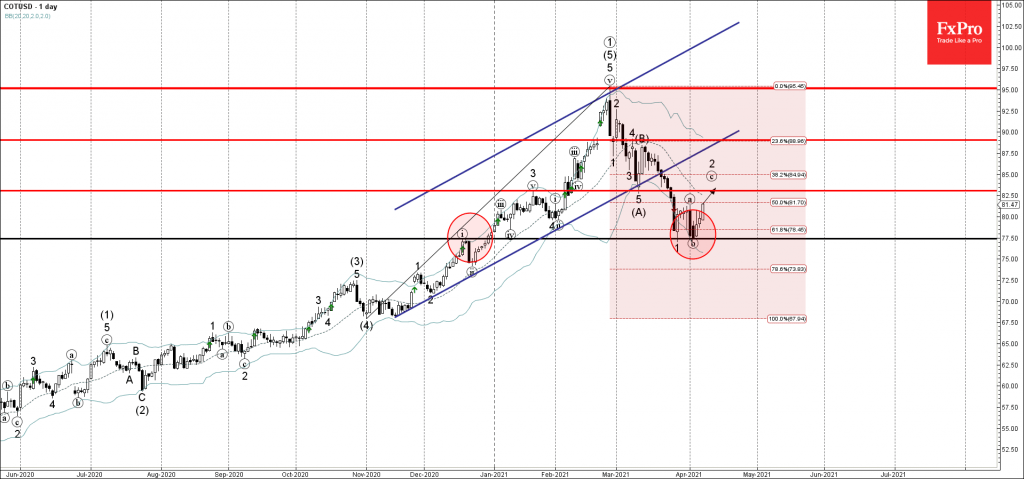
• Cotton reversed from pivotal support level 77.50

• Likely to reach resistance level 82.50

Cotton recently reversed up from the pivotal support level 77.50 (former resistance from December), standing close to the lower daily Bollinger Band and the 61.8% Fibonacci correction of the upward impulse form October.

The upward reversal from the support level 77.50 created the daily Japanese candlesticks reversal pattern Bullish Engulfing.

Cotton is likely to rise further in the active impulse wave (c) toward the next resistance level 82.50 (former strong support from March).

The FxPro Tech Analysis Team

The FxPro technical experts prepare a daily analysis of the most active currency pairs (majors, crosses, exotics) and commodities. Selected instruments are reviewed on daily trends (D1, H4), using the active Elliott Wave setups, Japanese candlesticks, indicators, and support/resistance levels.

Share
Published by
The FxPro Tech Analysis Team
Tags: cotton

Recent Posts

Bitcoin Cash Wave Analysis – 12 January 2026

Bitcoin Cash: ⬇️ Sell - Bitcoin Cash reversed from resistance area - Likely to fall…

4 hours ago

EURJPY Wave Analysis – 12 January 2026

EURJPY: ⬆️ Buy - EURJPY reversed from support area - Likely to rise to resistance…

4 hours ago

Gold shines on an anti-fiat thesis

The dollar suffered due to threats to the Fed’s independence. Gold managed to renew its…

14 hours ago

SP500 Current situation #trading #tradelikeapro #sp500 #tradingshorts #tradingstrategy

Today is Monday, the 12th of January, and once again we will talk about the…

14 hours ago

Crypto: sell-the-growth continues

Crypto markets remain volatile; Bitcoin faces selling pressure, XRP slips, Monero surges, and market signals…

15 hours ago

CHFJPY Wave Analysis – 9 January 2026

CHFJPY: ⬆️ Buy - CHFJPY reversed from support area - Likely to rise to resistance…

3 days ago

This website uses cookies