Categories: Technical analysis

Cotton Wave Analysis 30 October, 2020

• Cotton reversed from resistance area

• Likely to fall to 68.00

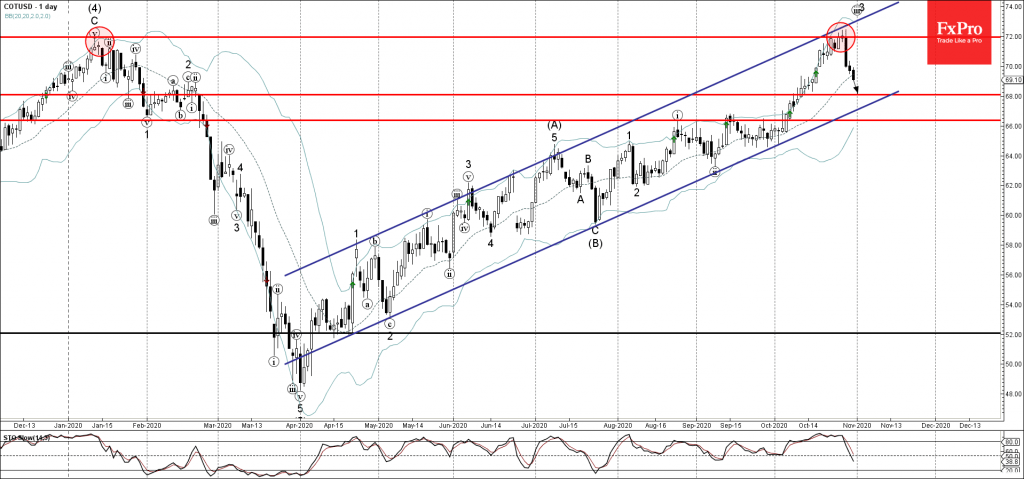
Cotton continues to fall strongly after the earlier downward reversal from the major resistance zone located between themulti-month resistance level 72.00 (which started the strong downtrend in January), upper daily Bollinger Band and the resistance trendline of the daily up channel from April.

The downward reversal from this resistance zone created the daily Japanese candlesticks reversal pattern Evening Star Doji.

Cotton is likely to fall further toward the next support level 68.00 (former resistance level from February).

The FxPro Tech Analysis Team

The FxPro technical experts prepare a daily analysis of the most active currency pairs (majors, crosses, exotics) and commodities. Selected instruments are reviewed on daily trends (D1, H4), using the active Elliott Wave setups, Japanese candlesticks, indicators, and support/resistance levels.

Share
Published by
The FxPro Tech Analysis Team
Tags: cotton

Recent Posts

Forex has set its priorities

In 2026, experts favour the yen, see modest euro growth, and expect pressure on the…

2 hours ago

Bear market rebound in crypto is likely to continue

Crypto rebounds continue; Bitcoin faces resistance, with a mixed market outlook ahead, as regulatory changes…

3 hours ago

Coca-Cola Wave Analysis – 4 December 2025

Coca-Cola: ⬇️ Sell - Coca-Cola reversed from long-term resistance level 73.25 - Likely to fall to…

16 hours ago

DraftKings Wave Analysis – 4 December 2025

DraftKings: ⬆️ Buy - DraftKings reversed from support zone - Likely to rise to resistance level…

16 hours ago

NVDA Wave Analysis – 4 December 2025

NVDA: ⬆️ Buy - NVDA reversed from support zone - Likely to rise to resistance level…

18 hours ago

Basic Attention Token Wave Analysis – 4 December 2025

Basic Attention Token: ⬇️ Sell - Basic Attention Token reversed from resistance level 0.2800 - Likely…

18 hours ago

This website uses cookies