Categories: Technical analysis

Cotton Wave Analysis – 21 December , 2018

  • Cotton broke multi-month key support level 75.30
  • Further losses are likely

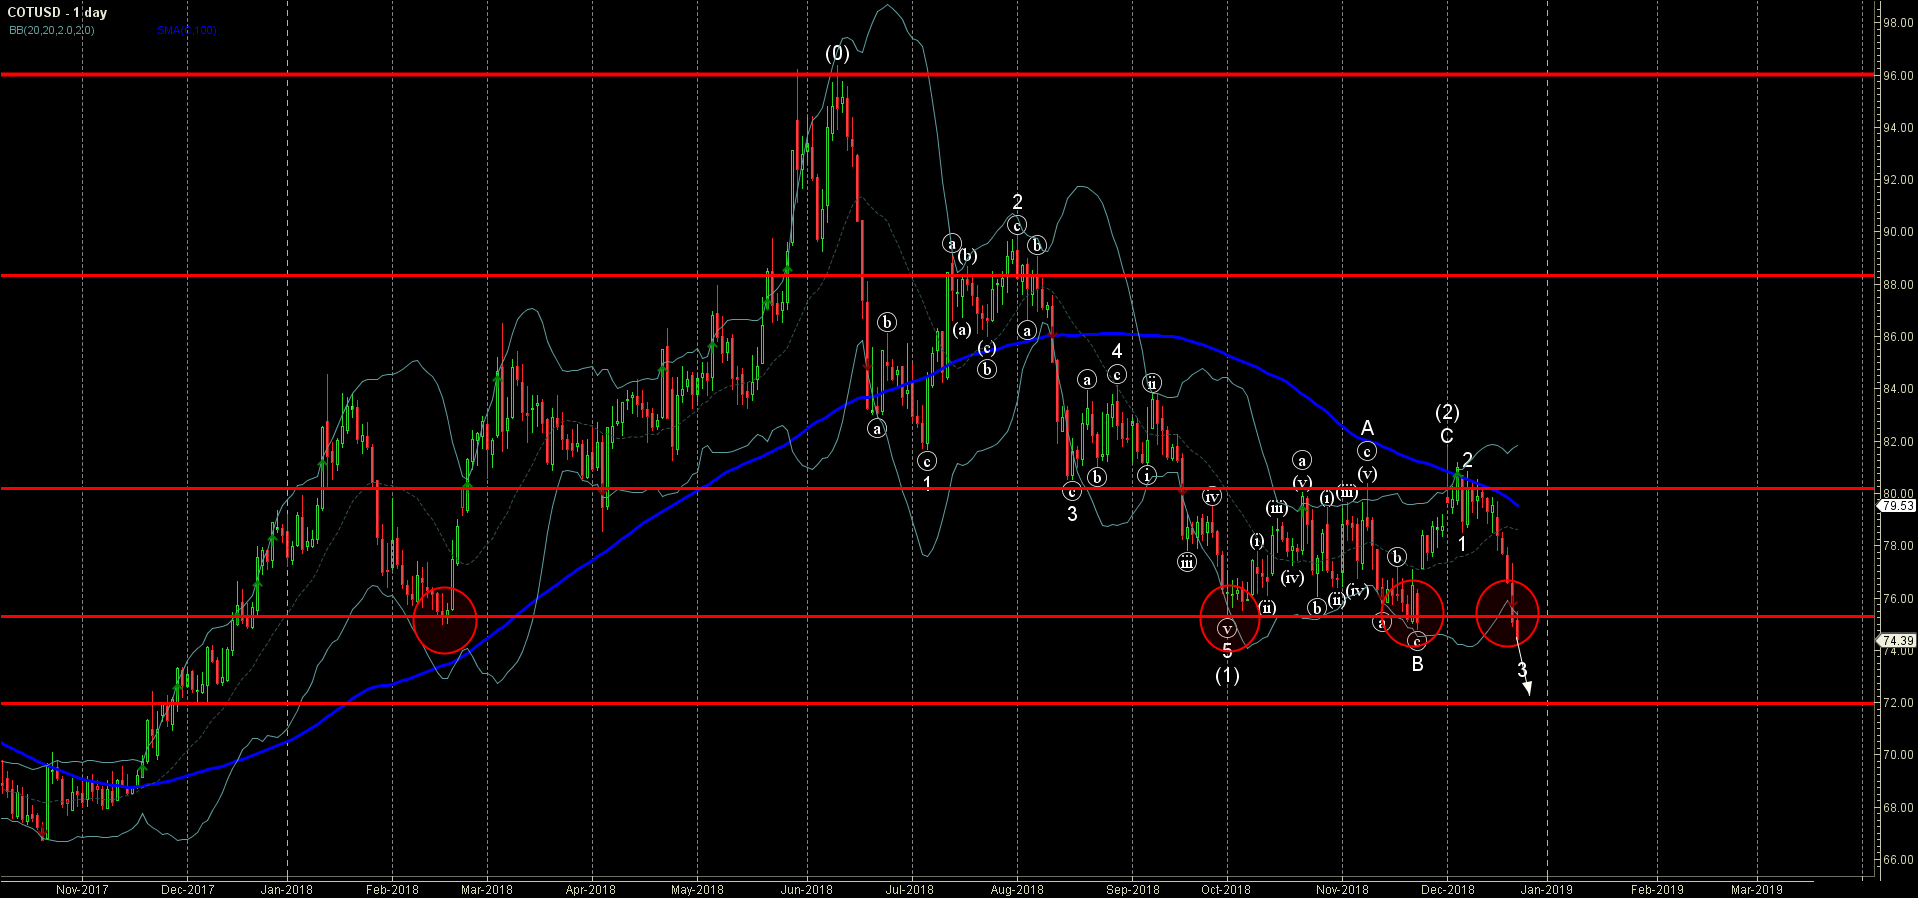
Cotton today broke through the multi-month support level 75.30 (which has been steadily reversing the price from the middle of February – as can be seen from the daily Cotton chart below).

The breakout of this support level should accelerate the active short-term impulse wave 3 which belongs to the medium-term impulse wave (3) – which started at the end of November from the major resistance level 80.00.

Cotton is expected to fall further and re-test the next support level 72.00 (target price for the completion of the active impulse wave 3).

AddThis Website Tools
The FxPro Tech Analysis Team

The FxPro technical experts prepare a daily analysis of the most active currency pairs (majors, crosses, exotics) and commodities. Selected instruments are reviewed on daily trends (D1, H4), using the active Elliott Wave setups, Japanese candlesticks, indicators, and support/resistance levels.

Share
Published by
The FxPro Tech Analysis Team
Tags: COTUSD

Recent Posts

Nikkei 225 Wave Analysis – 23 April 2025

Nikkei 225: ⬆️ Buy - Nikkei 225 broke the resistance area - Likely to rise…

4 hours ago

EURCHF Wave Analysis – 23 April 2025

EURCHF: ⬆️ Buy - EURCHF broke the resistance area - Likely to rise to resistance…

4 hours ago

CADJPY Wave Analysis – 23 April 2025

CADJPY: ⬆️ Buy - CADJPY reversed from strong support area - Likely to rise to…

6 hours ago

USDJPY Wave Analysis – 23 April 2025

USDJPY: ⬆️ Buy - USDJPY reversed from the support area - Likely to rise to…

6 hours ago

Europe’s Growth Stalls Again as the Euro Enters Correction Mode

Eurozone business activity slows as falling orders and declining confidence impact growth. Manufacturing PMI remains…

11 hours ago

The Rapid Assault on Crypto

The cryptocurrency market experienced a significant surge, with market capitalisation reaching $2.95 trillion. Bitcoin is…

14 hours ago