Categories: Technical analysis

Cotton Wave Analysis – 15 September, 2020

• Cotton reversed from resistance level 66.35

• Likely to fall to 64.00

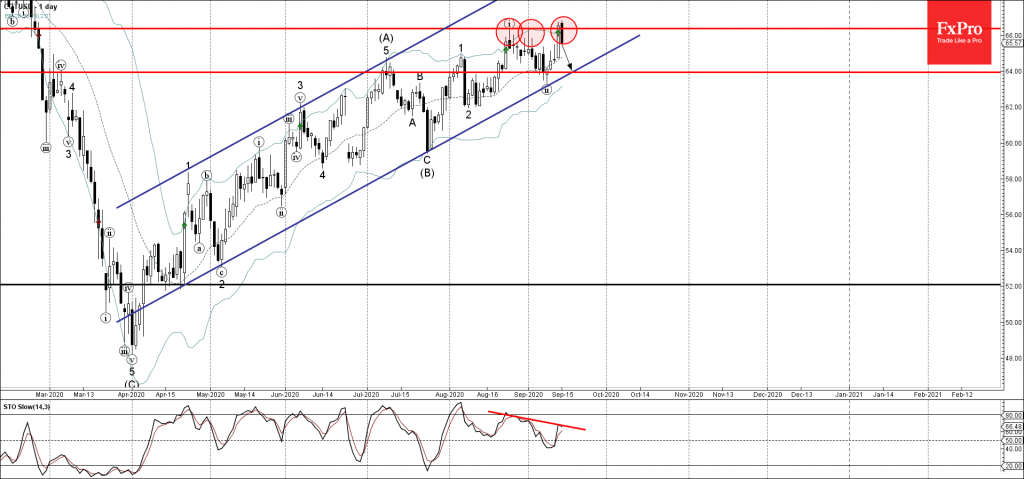
Cotton recently reversed down from the resistance level 66.35 (top of the two daily consecutive Shooting Stars from August) – standing near the upper daily Bollinger Band.

The downward reversal from the resistance level 66.35 stopped the previous sharp upward impulse wave (iii).

Given the clear bearish divergence on the daily Stochastic indicator – Cotton is likely to fall further toward the next support level 64.00 (which intersects with the support trendline of the daily up channel from March).

AddThis Website Tools
The FxPro Tech Analysis Team

The FxPro technical experts prepare a daily analysis of the most active currency pairs (majors, crosses, exotics) and commodities. Selected instruments are reviewed on daily trends (D1, H4), using the active Elliott Wave setups, Japanese candlesticks, indicators, and support/resistance levels.

Share
Published by
The FxPro Tech Analysis Team
Tags: COTUSD

Recent Posts

Adobe Wave Analysis – 13 March 2025

Adobe: ⬇️ Sell - Adobe broke round support level 400.00 - Likely to fall to…

10 hours ago

Apple Wave Analysis – 13 March 2025

Apple: ⬇️ Sell - Apple broke support area - Likely to fall to support level…

10 hours ago

Gold Wave Analysis – 13 March 2025

Gold: ⬆️ Buy - Gold broke resistance level 2962.00 - Likely to rise to resistance…

11 hours ago

EURGBP Wave Analysis – 13 March 2025

EURGBP: ⬇️ Sell - EURGBP reversed from key resistance level 0.8450 - Likely to fall…

11 hours ago

Gold climbs on lower rate speculations

The gold price has resumed updating its all-time highs on the back of speculations around…

17 hours ago

Crypto: just a bumpy downtrend

The crypto market experienced a drop, but towards the end of the week, there was…

18 hours ago