Categories: Technical analysis

Cotton Wave Analysis – 11 June, 2019

  • Cotton reversed from resistance area
  • Further losses are likely

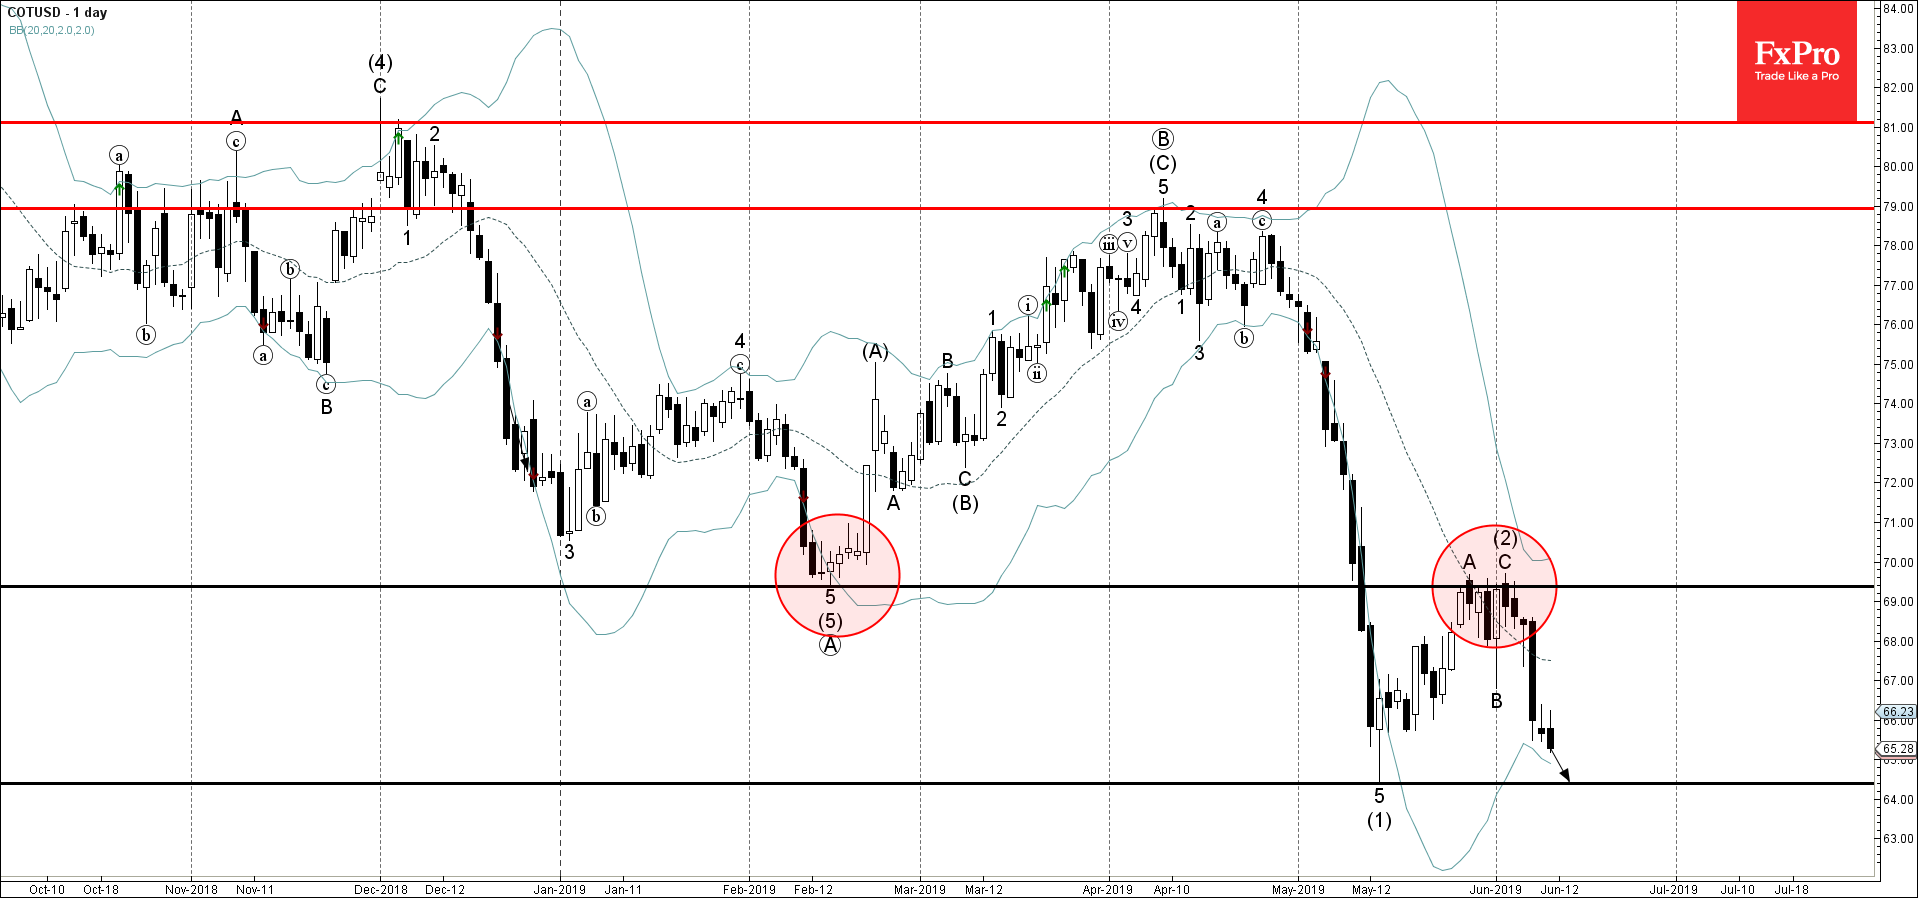
Cotton recently reversed down from the resistance area lying between the key resistance level 69.40 (former monthly low from February) and the upper daily Bollinger Band.

The downward reversal from this resistance area completed the previous medium-term ABC correction (2) from the middle of May.

Cotton is expected to fall further and retest the next support level 64.40 (top of the previous impulse wave (1) from the middle of May).

AddThis Website Tools
The FxPro Tech Analysis Team

The FxPro technical experts prepare a daily analysis of the most active currency pairs (majors, crosses, exotics) and commodities. Selected instruments are reviewed on daily trends (D1, H4), using the active Elliott Wave setups, Japanese candlesticks, indicators, and support/resistance levels.

Share
Published by
The FxPro Tech Analysis Team
Tags: COTUSD

Recent Posts

Pfizer Wave Analysis – 27 March 2025

Pfizer: ⬇️ Sell - Pfizer broke support level 25.20 - Likely to fall to support level…

21 minutes ago

Silver Wave Analysis – 27 March 2025

Silver: ⬆️ Buy - Silver broke resistance area - Likely to rise to resistance level…

22 minutes ago

EURGBP Wave Analysis – 27 March 2025

EURGBP: ⬇️ Sell - EURGBP broke support area - Likely to fall to support level…

5 hours ago

3M Wave Analysis – 27 March 2025

3M: ⬇️ Sell - 3M reversed from resistance area - Likely to fall to support…

5 hours ago

Smashed Hopes for US Stocks Recovery

The US stock market faced resistance from new auto tariffs and concerns about global response,…

7 hours ago

Gold and Silver about to break the ceiling

Gold has experienced growth, reaching historical highs due to new tariff wars. Silver has also…

9 hours ago