Categories: Technical analysis

Cotton Wave Analysis – 11 July, 2019

  • Cotton falling inside impulse wave 3
  • Further losses are likely

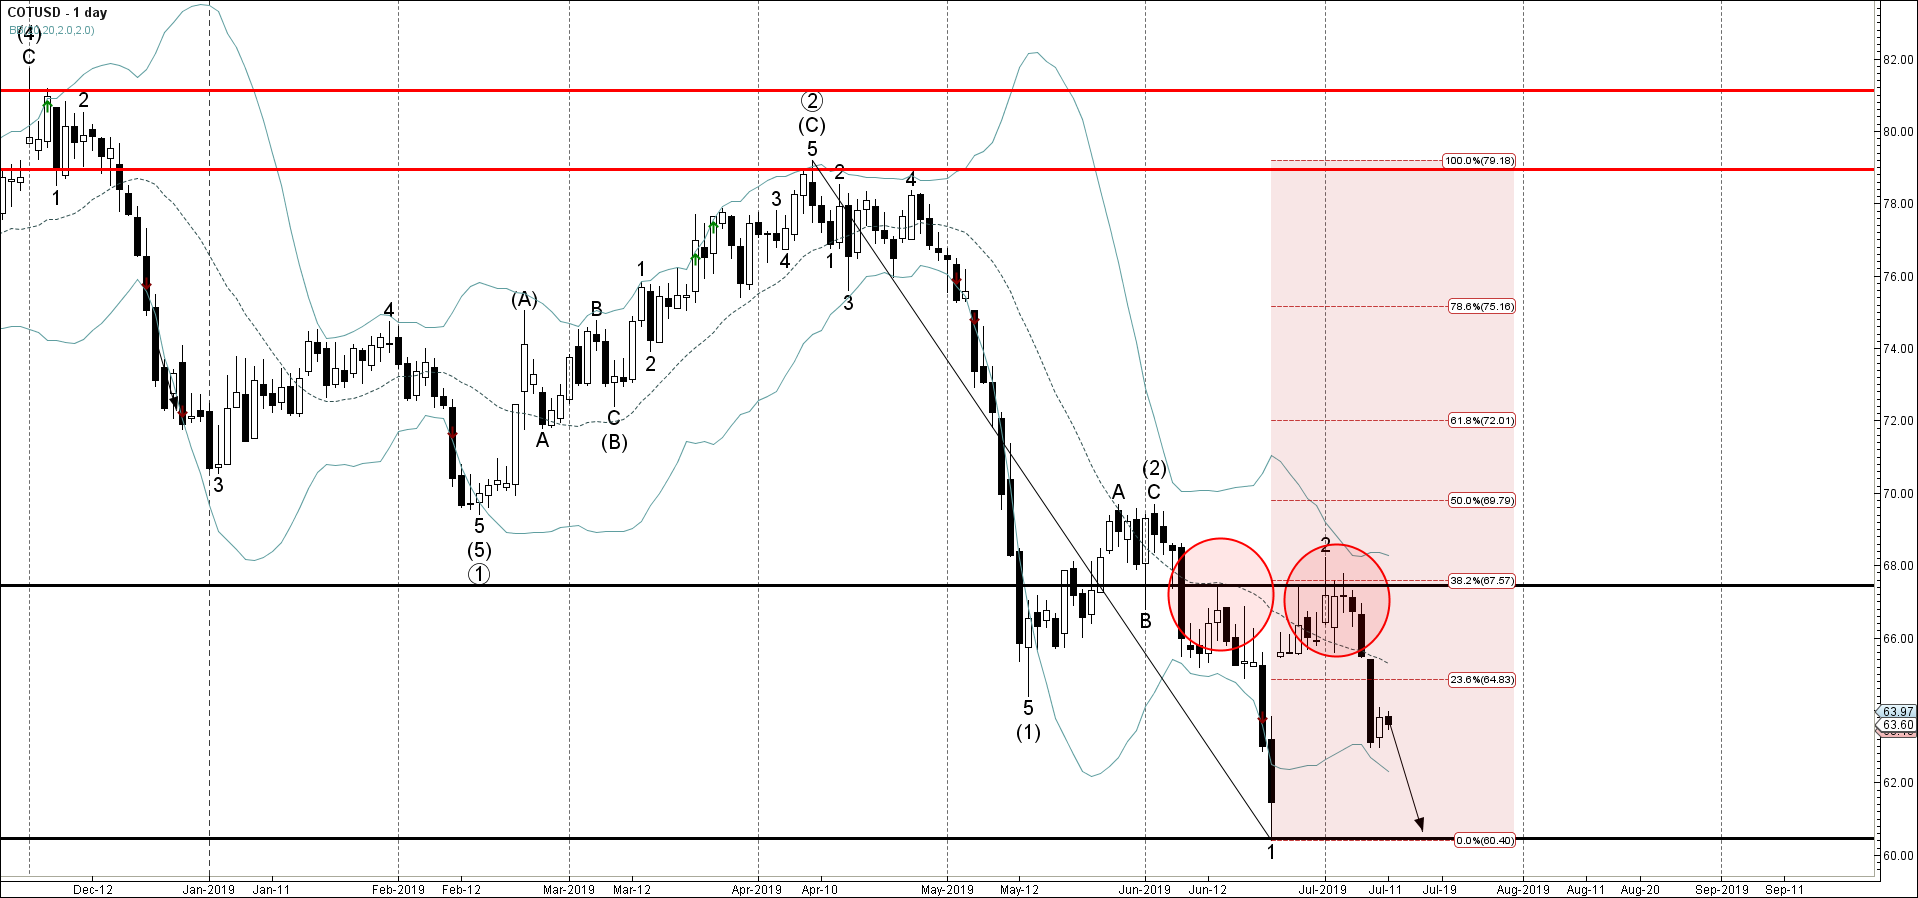
Cotton continues to fall inside the short-term impulse wave 3 which started earlier from the resistance area lying between the key resistance level 67.45, upper daily Bollinger Band and the 38.2% Fibonacci correction of the previous downward impulse from April.

The downward reversal from this resistance area started the active short-term impulse wave 3.

Cotton is expected to fall further and retest the next support level 60.45 (low of the previous sharp impulse wave 1).

AddThis Website Tools
The FxPro Tech Analysis Team

The FxPro technical experts prepare a daily analysis of the most active currency pairs (majors, crosses, exotics) and commodities. Selected instruments are reviewed on daily trends (D1, H4), using the active Elliott Wave setups, Japanese candlesticks, indicators, and support/resistance levels.

Share
Published by
The FxPro Tech Analysis Team
Tags: COTUSD

Recent Posts

Ethereum gives way

The crypto market remains in a downtrend, with Ethereum losing market share while Bitcoin's share…

4 hours ago

GBPUSD Wave Analysis – 18 March 2025

GBPUSD: ⬆️ Buy - GBPUSD reversed from support zone - Likely to rise to resistance…

17 hours ago

GBPAUD Wave Analysis – 18 March 2025

GBPAUD: ⬆️ Buy - GBPAUD reversed from the support zone - Likely to rise to…

17 hours ago

Solana Wave Analysis – 18 March 2025

Solana: ⬇️ Sell - Solana reversed from the resistance zone - Likely to fall to…

19 hours ago

CHFJPY Wave Analysis – 18 March 2025

CHFJPY: ⬆️ Buy - CHFJPY broke resistance zone - Likely to rise to resistance level…

19 hours ago

The crypto market is stuck in the mud

Market Picture The crypto market has been hovering in a narrow range for the past…

23 hours ago