Categories: Technical analysis

Costco Wave Analysis – 5 June 2025

Costco: ⬇️ Sell

– Costco reversed from the resistance zone

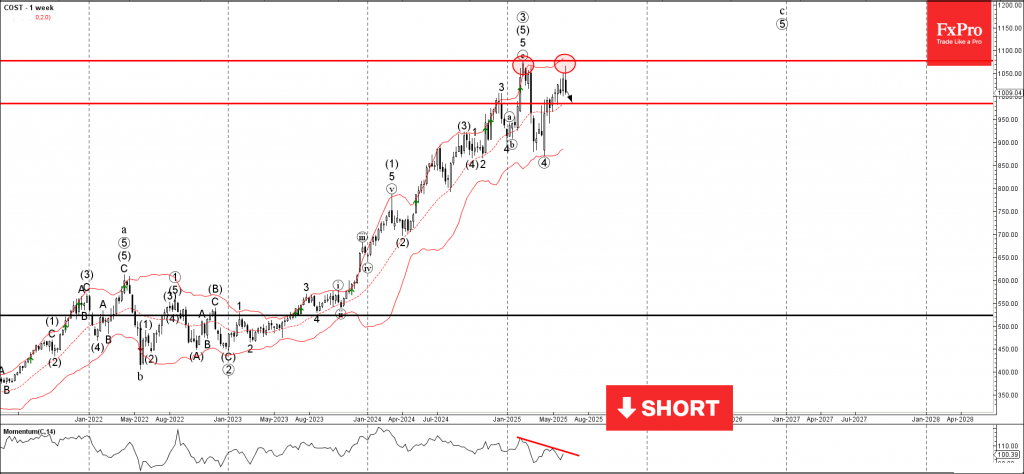
– Likely to fall to support level 985.00

Costco recently reversed down sharply from the resistance zone located between the key resistance 1080.00 (which stopped the previous impulse wave 5) and the upper weekly Bollinger Band.

The downward reversal from this resistance zone stopped the earlier weekly impulse wave 5 from April.

Given the strength of the nearby resistance zone and the bearish divergence on the weekly momentum indicator, Costco can be expected to fall to the next support level 985.00.

The FxPro Tech Analysis Team

The FxPro technical experts prepare a daily analysis of the most active currency pairs (majors, crosses, exotics) and commodities. Selected instruments are reviewed on daily trends (D1, H4), using the active Elliott Wave setups, Japanese candlesticks, indicators, and support/resistance levels.

Share
Published by
The FxPro Tech Analysis Team
Tags: Costco

Recent Posts

Forex has set its priorities

In 2026, experts favour the yen, see modest euro growth, and expect pressure on the…

2 hours ago

Bear market rebound in crypto is likely to continue

Crypto rebounds continue; Bitcoin faces resistance, with a mixed market outlook ahead, as regulatory changes…

3 hours ago

Coca-Cola Wave Analysis – 4 December 2025

Coca-Cola: ⬇️ Sell - Coca-Cola reversed from long-term resistance level 73.25 - Likely to fall to…

16 hours ago

DraftKings Wave Analysis – 4 December 2025

DraftKings: ⬆️ Buy - DraftKings reversed from support zone - Likely to rise to resistance level…

16 hours ago

NVDA Wave Analysis – 4 December 2025

NVDA: ⬆️ Buy - NVDA reversed from support zone - Likely to rise to resistance level…

18 hours ago

Basic Attention Token Wave Analysis – 4 December 2025

Basic Attention Token: ⬇️ Sell - Basic Attention Token reversed from resistance level 0.2800 - Likely…

18 hours ago

This website uses cookies