Categories: Technical analysis

Costco Wave Analysis – 27 November 2025

Costco: ⬆️ Buy

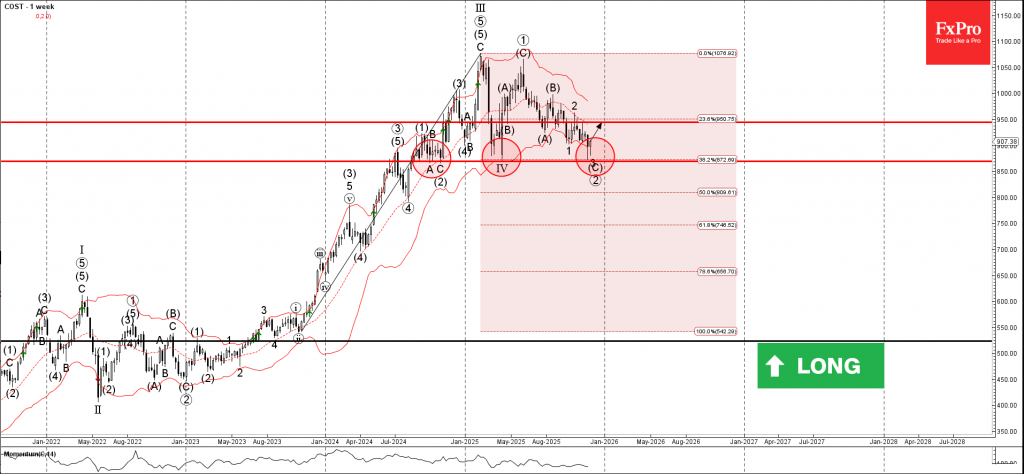
– Costco reversed from support level 870.00

– Likely to rise to resistance level 950.00

Costco recently reversed from support area between the support level 870.00 (which has been reversing the price from July of 2024), lower weekly Bollinger Band and the 38.2% Fibonacci retracement of the upward impulse from 2023.

The upward reversal from this support area stopped the previous weekly impulse wave C of the long-term ABC correction (2) from May.

Given the strong multi-year uptrend, Costco can be expected to rise to the next resistance level 950.00.

The FxPro Tech Analysis Team

The FxPro technical experts prepare a daily analysis of the most active currency pairs (majors, crosses, exotics) and commodities. Selected instruments are reviewed on daily trends (D1, H4), using the active Elliott Wave setups, Japanese candlesticks, indicators, and support/resistance levels.

Share
Published by
The FxPro Tech Analysis Team
Tags: Costco

Recent Posts

NZDCAD Wave Analysis – 7 January 2026

NZDCAD: ⬆️ Buy - NZDCAD reversed from support zone - Likely to rise to resistance…

5 hours ago

Bitcoin Wave Analysis – 7 January 2026

Bitcoin: ⬇️ Sell - Bitcoin reversed from resistance zone - Likely to fall to support…

5 hours ago

EURGBP Wave Analysis – 7 January 2026

EURGBP: ⬆️ Buy - EURGBP reversed from support zone - Likely to rise to resistance…

5 hours ago

Brent Crude Oil Wave Analysis – 7 January 2026

Brent Crude Oil: ⬇️ Sell - Brent Crude Oil reversed from resistance zone - Likely…

5 hours ago

Old fears about the euro have returned

The resurgence of the political crisis in France is weighing on EURUSD The US dollar…

14 hours ago

The crypto market has hit the upper limit of its rebound

The crypto market faces resistance at $3.2T; sentiment rises, but selling pressure persists. Bitcoin and…

16 hours ago

This website uses cookies