Categories: Technical analysis

Costco Wave Analysis 17 June 2024

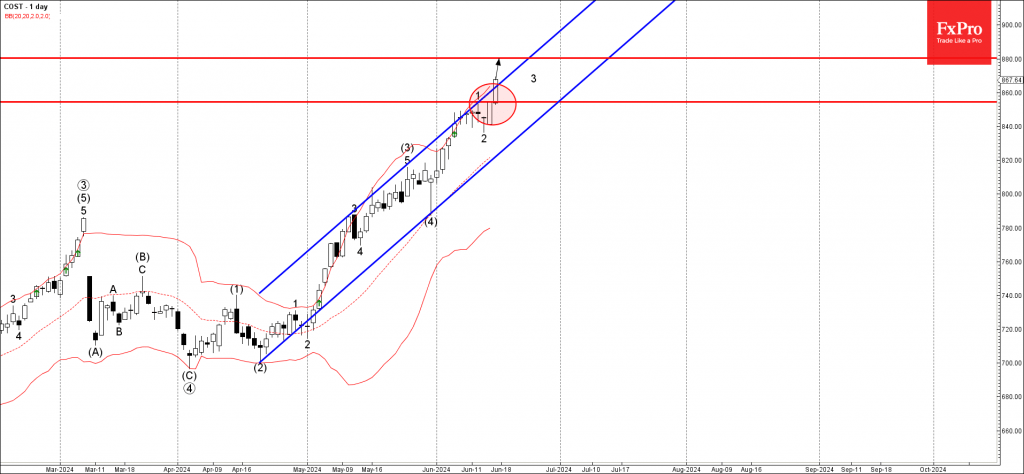
– Costco broke resistance level 855.00

– Likely to rise to resistance level 880.00

Costco recently broke the resistance level 855.00, which stopped the previous impulse wave 1at the start of June, as can be seen from the daily Costco chart below.

The breakout of the resistance level 855.00 coincided with the breakout of the resistance trendline of the daily up channel from April – which accelerated the active impulse wave 3.

Given the clear daily uptrend, Costco can be expected to rise further to the next resistance level 880.00, target for the completion of the active correction (B).

The FxPro Tech Analysis Team

The FxPro technical experts prepare a daily analysis of the most active currency pairs (majors, crosses, exotics) and commodities. Selected instruments are reviewed on daily trends (D1, H4), using the active Elliott Wave setups, Japanese candlesticks, indicators, and support/resistance levels.

Share
Published by
The FxPro Tech Analysis Team
Tags: Costco

Recent Posts

Pro News Flash: Gold Bulls Take Control

🥇 Gold is regaining momentum as investors lean into geopolitics, a softer US dollar and…

6 hours ago

The dollar is forced to retreat

• The reduction in geopolitical risks in Venezuela has weakened the greenback. •  Precious metal investors…

9 hours ago

Nikkei 225 Wave Analysis – 5 January 2026

Nikkei 225: ⬆️ Buy - Nikkei 225 broke resistance level 51160.00 - Likely to rise…

24 hours ago

Gold Wave Analysis – 5 January 2026

Gold: ⬆️ Buy - Gold reversed from support zone - Likely to rise to resistance…

24 hours ago

Ethereum Wave Analysis – 5 January 2026

Ethereum: ⬆️ Buy - Ethereum broke round resistance level 3000.00 - Likely to rise to…

1 day ago

Platinum Wave Analysis – 5 January 2026

Platinum: ⬆️ Buy - Platinum reversed from support zone - Likely to rise to resistance…

1 day ago

This website uses cookies