Categories: Technical analysis

Costco Wave Analysis – 16 July 2025

Costco: ⬇️ Sell

– Costco broke the support area

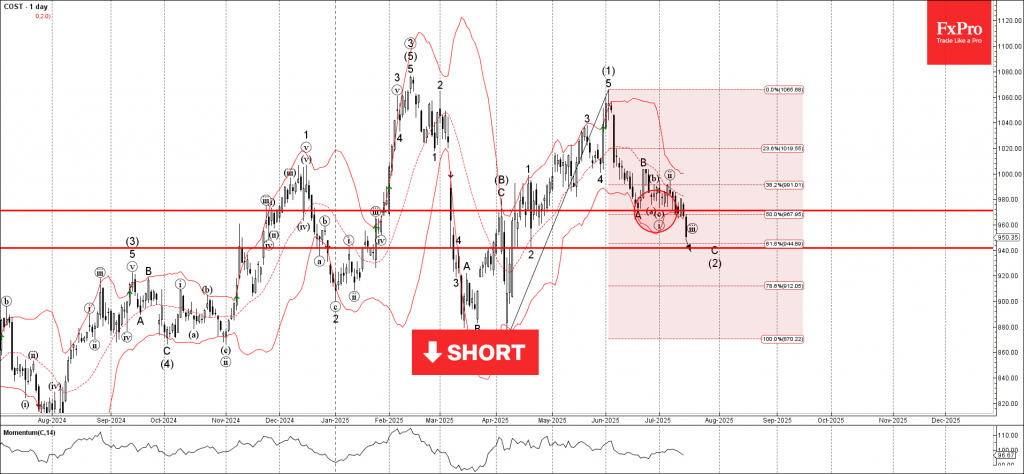
– Likely to fall to support level 940.00

Costco recently broke the support area located between the pivotal support level 970.00 and the 50% Fibonacci correction of the upward impulse from April.

The breakout of this support area accelerated the C-wave of the active ABC correction (2).

Costco can be expected to fall to the next support level 940.00 (target price for the completion of the active C-wave).

The FxPro Tech Analysis Team

The FxPro technical experts prepare a daily analysis of the most active currency pairs (majors, crosses, exotics) and commodities. Selected instruments are reviewed on daily trends (D1, H4), using the active Elliott Wave setups, Japanese candlesticks, indicators, and support/resistance levels.

Share
Published by
The FxPro Tech Analysis Team
Tags: Costco

Recent Posts

Bitcoin is holding, while Solana is on the edge

Bitcoin remains stable near $87K, outperforming altcoins, while Solana faces key support at $120. Institutional…

2 hours ago

The dollar’s wings have been clipped

Waller's dovish rhetoric halted the bears' attack on EURUSD. Slowing UK inflation caused the pound…

2 hours ago

Dow Jones Wave Analysis – 17 December 2025

Dow Jones: ⬇️ Sell - Dow Jones reversed from resistance level 49000.00 - Likely to fall…

18 hours ago

Comcast Wave Analysis – 17 December 2025

Comcast: ⬆️ Buy - Comcast broke resistance area - Likely to rise to resistance level 31.00…

18 hours ago

Platinum Wave Analysis – 17 December 2025

Platinum: ⬆️ Buy - Platinum broke resistance level 1800.00 - Likely to rise to resistance…

19 hours ago

Silver Wave Analysis – 17 December 2025

Silver: ⬆️ Buy - Silver broke resistance zone - Likely to rise to resistance level…

19 hours ago

This website uses cookies