Categories: Technical analysis

Corn Wave Analysis – 31 March, 2020

  • Corn under bearish pressure
  • Likely to fall to 333.00

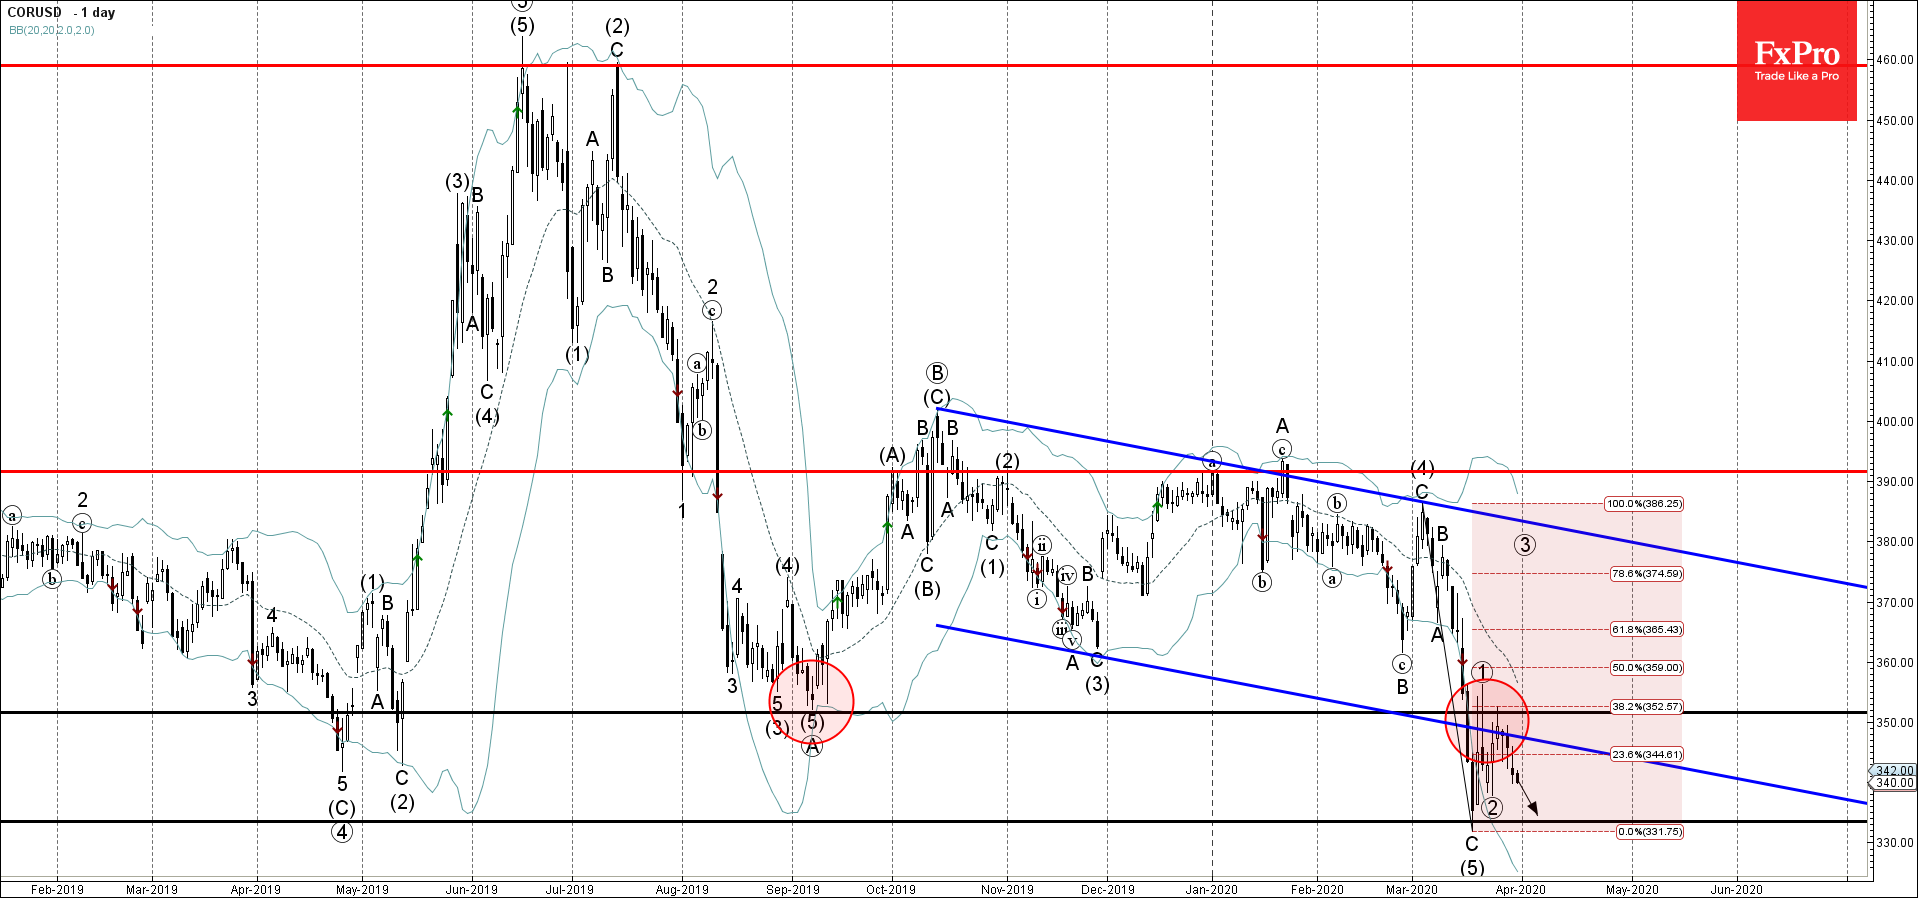
Corn under bearish pressure after the earlier downward reversal from resistance area lying between the major resistance level 350.00 (former multi-month support from September), 38.2% Fibonacci correction level of the previous sharp downward impulse (5) and the lower trendline of the recently broken down channel from October.

The previous time the price reversed from this resistance area Corn formed the daily reversal pattern Shooting Star.

Corn is likely to fall further toward the next support level 333.00 (low of the previous intermediate impulse wave (5)).

AddThis Website Tools
The FxPro Tech Analysis Team

The FxPro technical experts prepare a daily analysis of the most active currency pairs (majors, crosses, exotics) and commodities. Selected instruments are reviewed on daily trends (D1, H4), using the active Elliott Wave setups, Japanese candlesticks, indicators, and support/resistance levels.

Share
Published by
The FxPro Tech Analysis Team
Tags: CORUSD

Recent Posts

Bitcoin Wave Analysis – 22 April 2025

Bitcoin: ⬆️ Buy - Bitcoin broke round resistance level 90000.00 - Likely to rise to…

3 hours ago

AUDUSD Wave Analysis – 22 April 2025

AUDUSD: ⬇️ Sell - AUDUSD reversed from the key resistance level 0.6400 - Likely to…

3 hours ago

Crypto Market Escapes from Fear

Market Overview The crypto market has gained around 2% over the past seven days, with…

15 hours ago

Nike Wave Analysis – 21 April 2025

Nike: ⬆️ Buy - Nike reversed from the long-term support level 52.60 - Likely to…

1 day ago

Natural Gas Wave Analysis – 21 April 2025

Natural gas: ⬇️ Sell Natural gas broke support area Likely to fall to support level…

1 day ago

EURUSD Wave Analysis – 21 April 2025

EURUSD: ⬆️ Buy - EURUSD broke the resistance area - Likely to test resistance level…

1 day ago