Categories: Technical analysis

Corn Wave Analysis 29 December, 2020

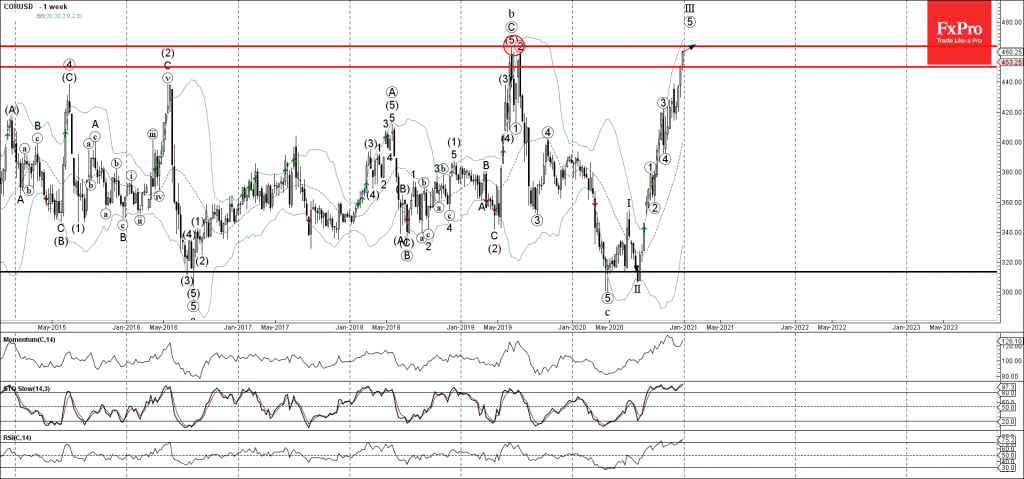
• Corn rising inside impulse sequence ⑤

• Likely to reach 464.00

Corn continues to rise inside the sharp weekly upward impulse sequence ⑤ from November – which is itself made out of multiple different size impulse waves visible on the daily and the hourly charts.

The price is currently approaching the major long-term resistance level 464.00 – which stopped the previous strong upward trend in the middle of 2019.

Corn is expected to reach the resistance level 464.00 – from where the downward correction is likely (given the overbought weekly Stochastic indicator and, especially, weekly RSI indicator).

The FxPro Tech Analysis Team

The FxPro technical experts prepare a daily analysis of the most active currency pairs (majors, crosses, exotics) and commodities. Selected instruments are reviewed on daily trends (D1, H4), using the active Elliott Wave setups, Japanese candlesticks, indicators, and support/resistance levels.

Share
Published by
The FxPro Tech Analysis Team
Tags: corn

Recent Posts

EURJPY Wave Analysis 2 May 2024

- EURJPY under strong bearish pressure - Likely to fall to support level 163.10 EURJPY…

13 hours ago

WTI crude oil Wave Analysis 2 May 2024

- WTI broke round support level 80.00 - Likely to fall to support level 76.00…

13 hours ago

ADP hints at another strong NFP on Friday

The monthly ADP labour market report showed that America created 192K new jobs in April, above…

2 days ago

Fed’s hawkish tone risks sinking S&P500 to 4700

Bears showed strength ahead of the FOMC decision.  U.S. indices sagged on Tuesday as investors…

2 days ago

A new stage of Bitcoin’s decline

Market Picture  Bitcoin's closing price on Tuesday became the lowest since late February, confirming the…

2 days ago

Ebay Wave Analysis 30 April 2024

- Ebay under the bearish pressure - Likely to fall to support level 51.00 Ebay…

3 days ago

This website uses cookies