Categories: Technical analysis

Corn Wave Analysis – 28 April, 2020

  • Corn approached long-term support level 304.0
  • Likely to correct up to 330.00

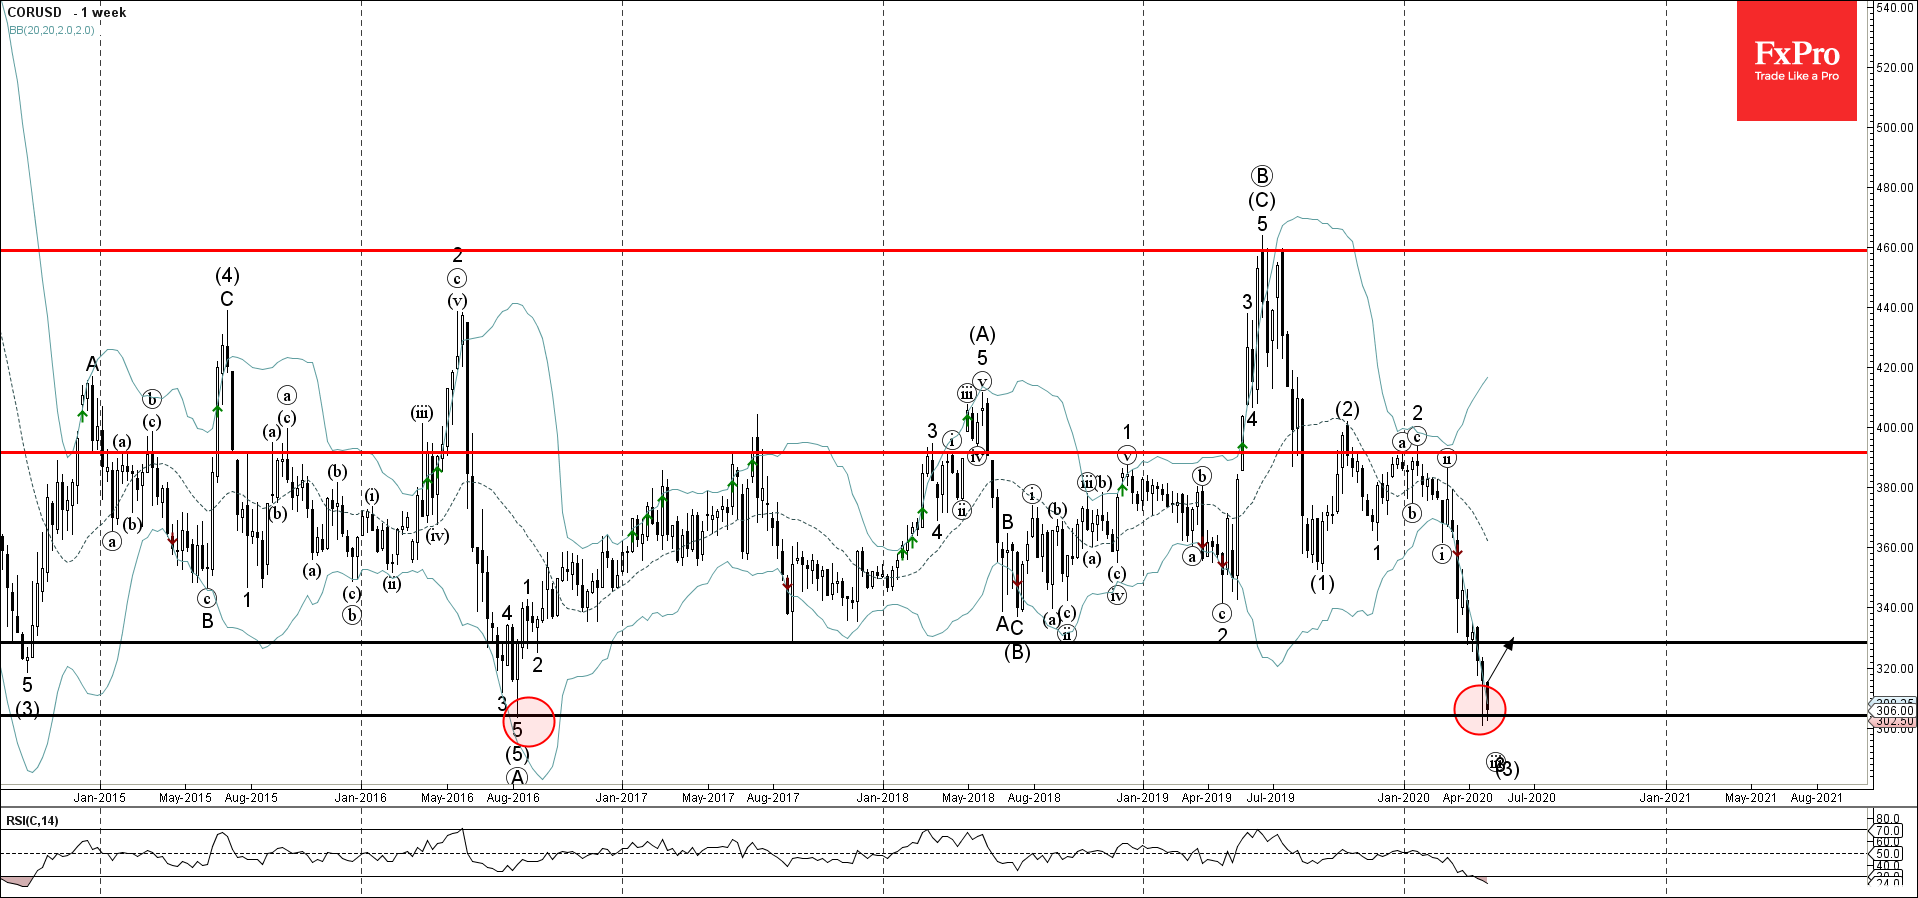
Corn is currently trading close to the major long-term support level 304.0 (former yearly low which started the sharp weekly uptrend in 2016)

This support level is standing well below of the lower weekly Bollinger Band – increasing the probability of the upward correction in the coming trading sessions.

With the weekly RSI in the oversold territory – Corn is expected to rise toward the next resistance level 330.00 (former yearly low from 2017, acting as resistance after it was broken earlier this year).


The FxPro Tech Analysis Team

The FxPro technical experts prepare a daily analysis of the most active currency pairs (majors, crosses, exotics) and commodities. Selected instruments are reviewed on daily trends (D1, H4), using the active Elliott Wave setups, Japanese candlesticks, indicators, and support/resistance levels.

Share
Published by
The FxPro Tech Analysis Team
Tags: CORUSD

Recent Posts

Forex has set its priorities

In 2026, experts favour the yen, see modest euro growth, and expect pressure on the…

1 hour ago

Bear market rebound in crypto is likely to continue

Crypto rebounds continue; Bitcoin faces resistance, with a mixed market outlook ahead, as regulatory changes…

2 hours ago

Coca-Cola Wave Analysis – 4 December 2025

Coca-Cola: ⬇️ Sell - Coca-Cola reversed from long-term resistance level 73.25 - Likely to fall to…

15 hours ago

DraftKings Wave Analysis – 4 December 2025

DraftKings: ⬆️ Buy - DraftKings reversed from support zone - Likely to rise to resistance level…

16 hours ago

NVDA Wave Analysis – 4 December 2025

NVDA: ⬆️ Buy - NVDA reversed from support zone - Likely to rise to resistance level…

17 hours ago

Basic Attention Token Wave Analysis – 4 December 2025

Basic Attention Token: ⬇️ Sell - Basic Attention Token reversed from resistance level 0.2800 - Likely…

17 hours ago

This website uses cookies