Categories: Technical analysis

Corn Wave Analysis – 26 February, 2019

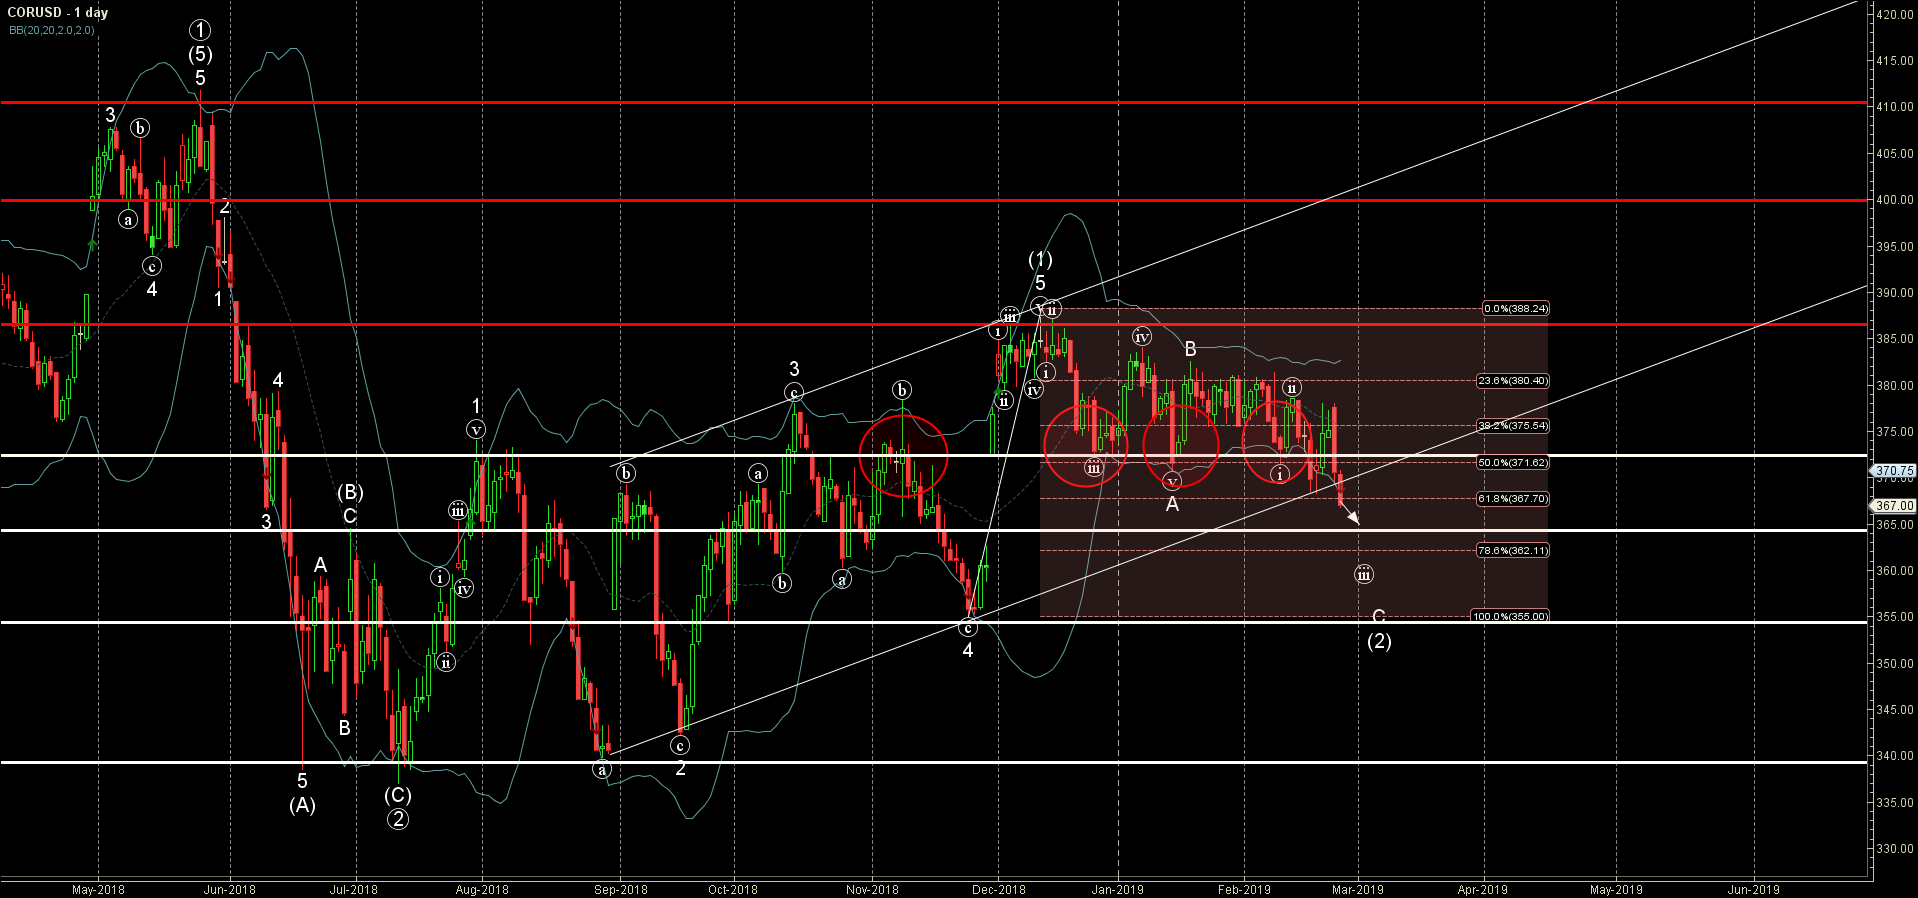
  • Corn broke support area
  • Further losses are likely

Corn recently broke sharply through the support area lying between the key support level 372.00 (which has been steadily reversing the price from the end of December) and the 50% Fibonacci correction of the previous sharp upward impulse 5 from November.

The breakout of the aforementioned support area accelerated the active short-term impulse wave C.

Corn is expected to fall further and re-test the next support level 365.00 – the breakout of which can lead to further losses toward 355.00 (monthly low from November).

The FxPro Tech Analysis Team

The FxPro technical experts prepare a daily analysis of the most active currency pairs (majors, crosses, exotics) and commodities. Selected instruments are reviewed on daily trends (D1, H4), using the active Elliott Wave setups, Japanese candlesticks, indicators, and support/resistance levels.

Share
Published by
The FxPro Tech Analysis Team
Tags: CORUSD

Recent Posts

Silver and gold recovered quickly. What’s next? 

Gold and silver have been enjoying a return to demand since early May, and buyers…

2 days ago

Toncoin catches up with XRP

Market picture  The crypto market added 2.8% in the last 24 hours to a total…

2 days ago

Adobe Wave Analysis 9 May 2024

- Adobe reversed from resistance level 500.00 - Likely to fall to support level 460.00…

3 days ago

Goldman Sachs Wave Analysis 9 May 2024

- Goldman Sachs rising inside impulse waves 3 and (3) - Likely to rise to…

3 days ago

WTI crude oil Wave Analysis 8 May 2024

- WTI crude oil reversed from support area - Likely to rise to resistance level…

4 days ago

AUDJPY Wave Analysis 8 May 2024

- AUDJPY reversed from support area - Likely to rise to resistance level 103.00 AUDJPY…

4 days ago

This website uses cookies