Categories: Technical analysis

Corn Wave Analysis 24 February, 2021

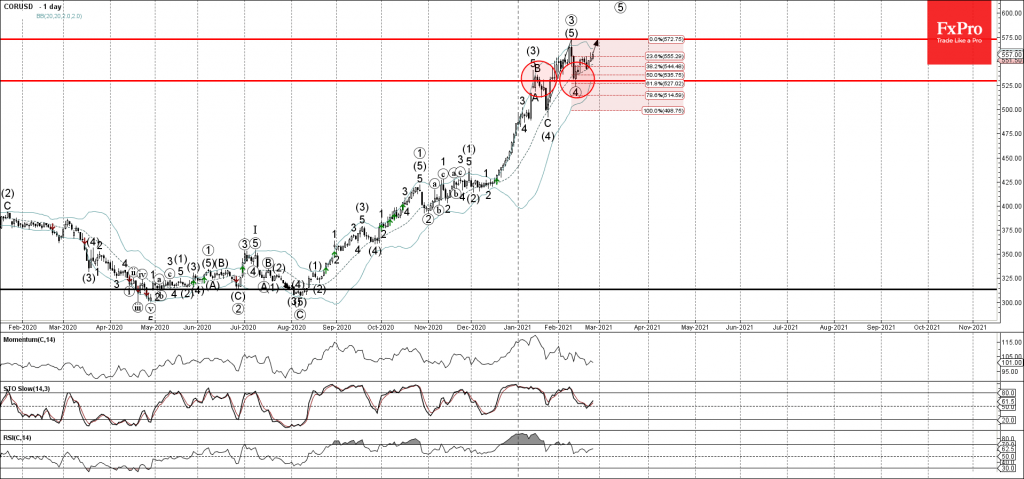
• Corn reversed from key support level 530.00

• Likely to reach resistance 575.00

Corn recently reversed up from the key support level 530.00 (former resistance level from the middle of January – which stopped the previous impulse wave (3)).

The support area near the support level 530.00 was strengthened by the lower daily Bollinger Band and by the 61.8% Fibonacci correction of the upward impulse from January.

Given the strong daily uptrend – the price is likely to rise further toward the next resistance level 575.00 (which stopped the previous impulse wave (5)).

AddThis Website Tools
The FxPro Tech Analysis Team

The FxPro technical experts prepare a daily analysis of the most active currency pairs (majors, crosses, exotics) and commodities. Selected instruments are reviewed on daily trends (D1, H4), using the active Elliott Wave setups, Japanese candlesticks, indicators, and support/resistance levels.

Share
Published by
The FxPro Tech Analysis Team
Tags: corn

Recent Posts

Video: Dollar and Indices are trying to find footing after the fall

The dollar experienced a sell-off but rallied back up by the end of the week.…

5 hours ago

What is next: BoJ, Fed, SNB & BoE Rates

The new week will be packed with economic data and decisions from key central banks.…

9 hours ago

Dollar attempts to rebound after oversold conditions

Despite economic factors working against the dollar, its oversold condition helped it this week or…

9 hours ago

USDCAD Wave Analysis – 14 March 2025

USDCAD: ⬇️ Sell - USDCAD reversed from key resistance level 1.4500 - Likely to fall…

10 hours ago

Solana Wave Analysis – 14 March 2025

Solana: ⬆️ Buy - Solana reversed from the long-term support level 113.75 - Likely to…

10 hours ago

Adobe Wave Analysis – 13 March 2025

Adobe: ⬇️ Sell - Adobe broke round support level 400.00 - Likely to fall to…

1 day ago