Categories: Technical analysis

Corn Wave Analysis – 22 April, 2020

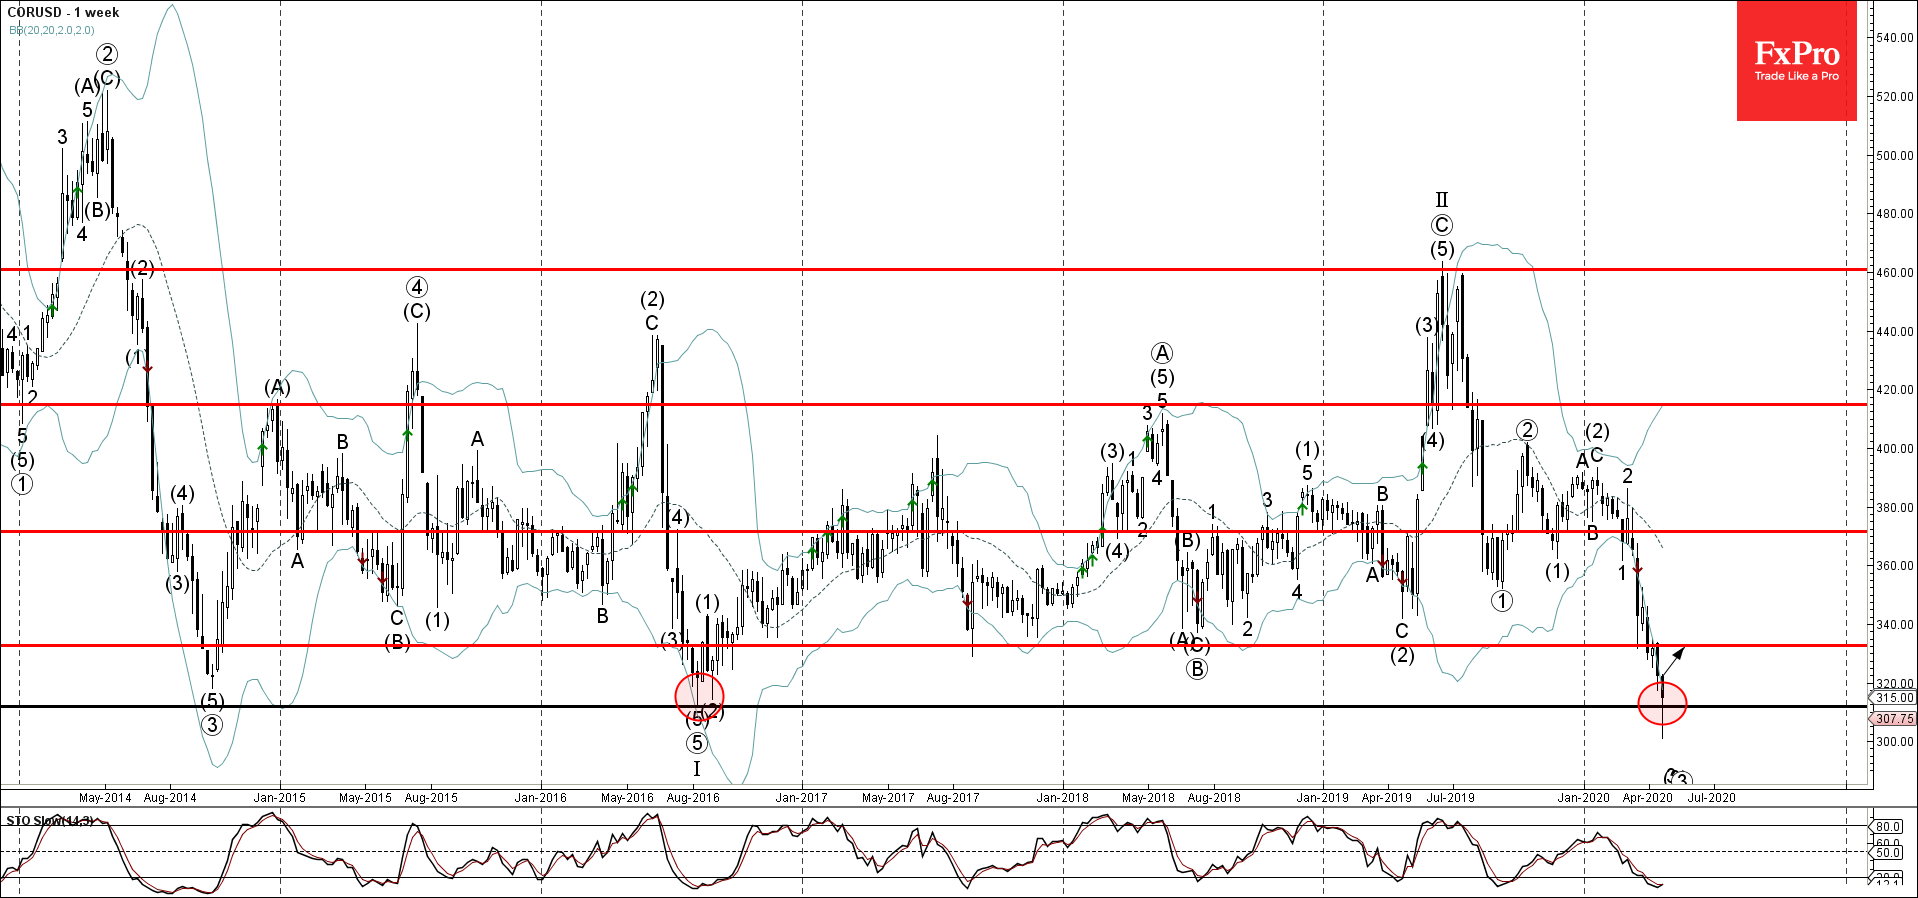
  • Corn reversed from long-term support level 305.00
  • Likely to rise to 330.00

Corn recently reversed up from the support zone lying between the long-term support level 305.00 (which also reversed the price in the middle of 2016, as can be seen from the weekly Corn chart below) and the lower weekly Bollinger Band.

The upward reversal from this support area stopped the previous multi-week downward impulse sequence (3).

Given the oversold daily Stochastic indicator – Corn is expected to rise further toward the next resistance level 330.00.

The FxPro Tech Analysis Team

The FxPro technical experts prepare a daily analysis of the most active currency pairs (majors, crosses, exotics) and commodities. Selected instruments are reviewed on daily trends (D1, H4), using the active Elliott Wave setups, Japanese candlesticks, indicators, and support/resistance levels.

Share
Published by
The FxPro Tech Analysis Team
Tags: CORUSD

Recent Posts

Nikkei 225 index Wave Analysis 20 September 2024

- Nikkei 225 index rising inside minor impulse waves 3 - Likely to reach resistance…

14 hours ago

NZDJPY Wave Analysis 20 September 2024

- NZDJPY rising inside corrective wave ii - Likely to rise to resistance level 91.65…

14 hours ago

Gold terminates the last sceptics

Gold started the week with new highs and ended the week up 1.3%, despite a…

20 hours ago

The Crypto Market’s Steady Ascent

Crypto market cap rose by 3.2% to $2.21 trillion overnight. This made the struggle to…

1 day ago

Gold Wave Analysis 19 September 2024

- Gold reversed from support level 2550.00 - Likely to rise to resistance level 2600.00…

2 days ago

S&P 500 Wave Analysis 19 September 2024

- S&P 500 broke key resistance level 5670.00 - Likely to rise to resistance level…

2 days ago

This website uses cookies