Categories: Technical analysis

Corn Wave Analysis – 19 November , 2018

  • Corn falling inside short-term correction
  • Further losses are likely

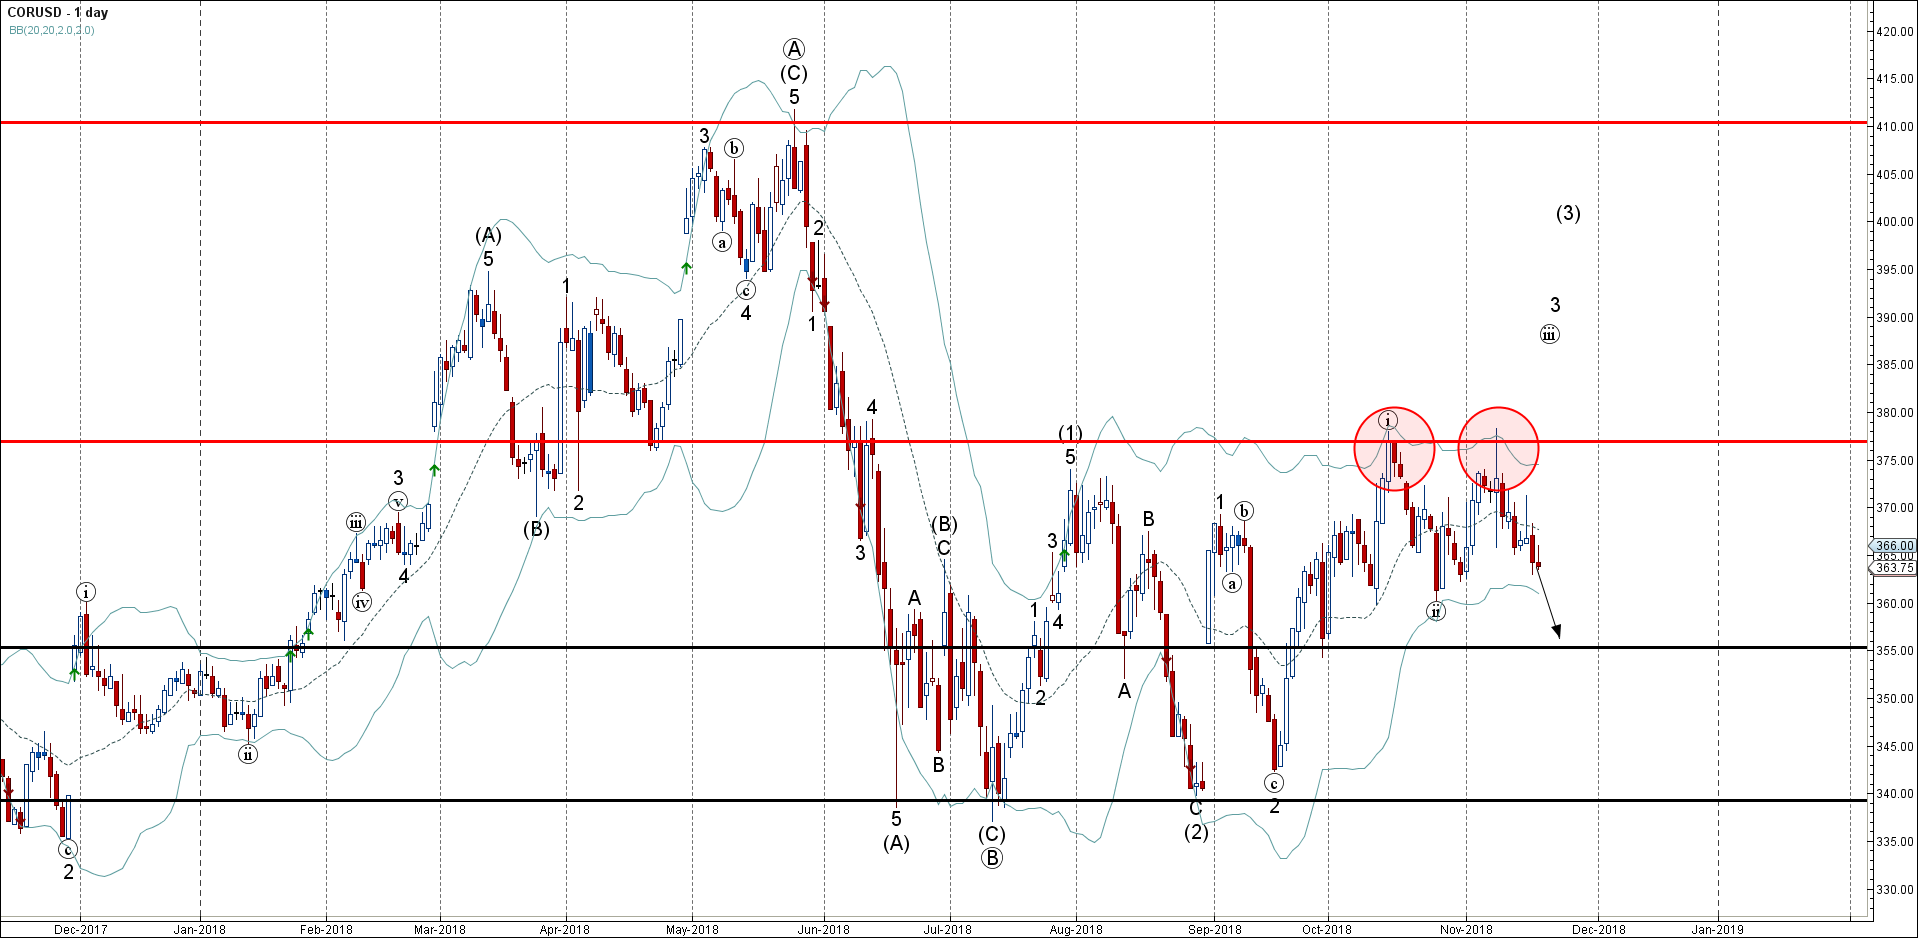
Corn continues to fall inside the short-term corrective wave, which started earlier from the resistance area lying between the strong resistance level 377.00 (monthly high from October) and the upper daily Bollinger Band.

The downward reversal from this resistance area created the daily Japanese candlesticks reversal pattern Long-Legged Doji.

Corn is expected to fall further and re-test the next support level 360.00 (low of the previous short-term correction (ii)) – the breakout of which can lead to further losses toward 355.00.

The FxPro Tech Analysis Team

The FxPro technical experts prepare a daily analysis of the most active currency pairs (majors, crosses, exotics) and commodities. Selected instruments are reviewed on daily trends (D1, H4), using the active Elliott Wave setups, Japanese candlesticks, indicators, and support/resistance levels.

Share
Published by
The FxPro Tech Analysis Team
Tags: CORUSD

Recent Posts

Forex has set its priorities

In 2026, experts favour the yen, see modest euro growth, and expect pressure on the…

1 hour ago

Bear market rebound in crypto is likely to continue

Crypto rebounds continue; Bitcoin faces resistance, with a mixed market outlook ahead, as regulatory changes…

2 hours ago

Coca-Cola Wave Analysis – 4 December 2025

Coca-Cola: ⬇️ Sell - Coca-Cola reversed from long-term resistance level 73.25 - Likely to fall to…

15 hours ago

DraftKings Wave Analysis – 4 December 2025

DraftKings: ⬆️ Buy - DraftKings reversed from support zone - Likely to rise to resistance level…

15 hours ago

NVDA Wave Analysis – 4 December 2025

NVDA: ⬆️ Buy - NVDA reversed from support zone - Likely to rise to resistance level…

17 hours ago

Basic Attention Token Wave Analysis – 4 December 2025

Basic Attention Token: ⬇️ Sell - Basic Attention Token reversed from resistance level 0.2800 - Likely…

17 hours ago

This website uses cookies