Categories: Technical analysis

Corn Wave Analysis – 16 January, 2020

  • Corn reversed from resistance area
  • Likely to fall to 370.00

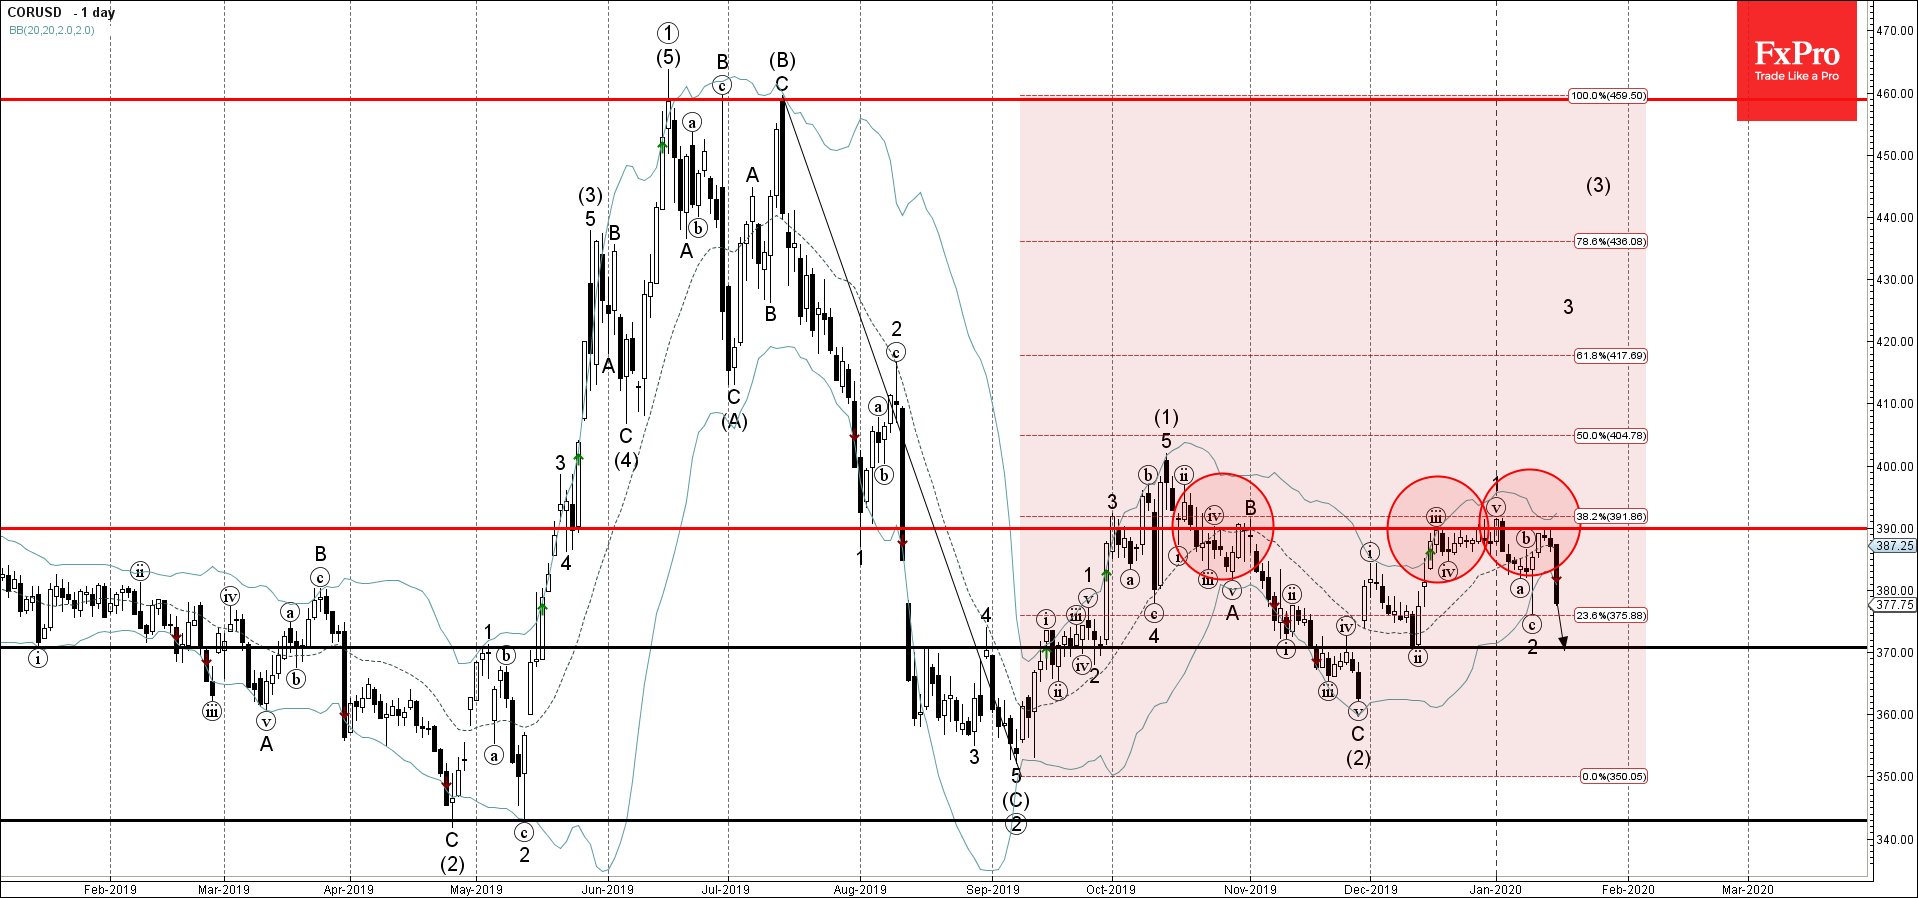
Corn recently reversed down from the resistance area lying between the multi-month resistance level 390.00 (which has been reversing the price from October), upper daily Bollinger Band and the 38.2% Fibonacci correction of the previous downward impulse from July.

The downward reversal from this resistance area stopped the previous impulse wave 1 from the end of November.

Corn is likely to fall further toward the next support level 370.00 (low of the previous correction (ii) from December).

The FxPro Tech Analysis Team

The FxPro technical experts prepare a daily analysis of the most active currency pairs (majors, crosses, exotics) and commodities. Selected instruments are reviewed on daily trends (D1, H4), using the active Elliott Wave setups, Japanese candlesticks, indicators, and support/resistance levels.

Share
Published by
The FxPro Tech Analysis Team
Tags: CORUSD

Recent Posts

Forex has set its priorities

In 2026, experts favour the yen, see modest euro growth, and expect pressure on the…

41 minutes ago

Bear market rebound in crypto is likely to continue

Crypto rebounds continue; Bitcoin faces resistance, with a mixed market outlook ahead, as regulatory changes…

2 hours ago

Coca-Cola Wave Analysis – 4 December 2025

Coca-Cola: ⬇️ Sell - Coca-Cola reversed from long-term resistance level 73.25 - Likely to fall to…

15 hours ago

DraftKings Wave Analysis – 4 December 2025

DraftKings: ⬆️ Buy - DraftKings reversed from support zone - Likely to rise to resistance level…

15 hours ago

NVDA Wave Analysis – 4 December 2025

NVDA: ⬆️ Buy - NVDA reversed from support zone - Likely to rise to resistance level…

16 hours ago

Basic Attention Token Wave Analysis – 4 December 2025

Basic Attention Token: ⬇️ Sell - Basic Attention Token reversed from resistance level 0.2800 - Likely…

16 hours ago

This website uses cookies