- Corn reversed from support area
- Further gains are likely
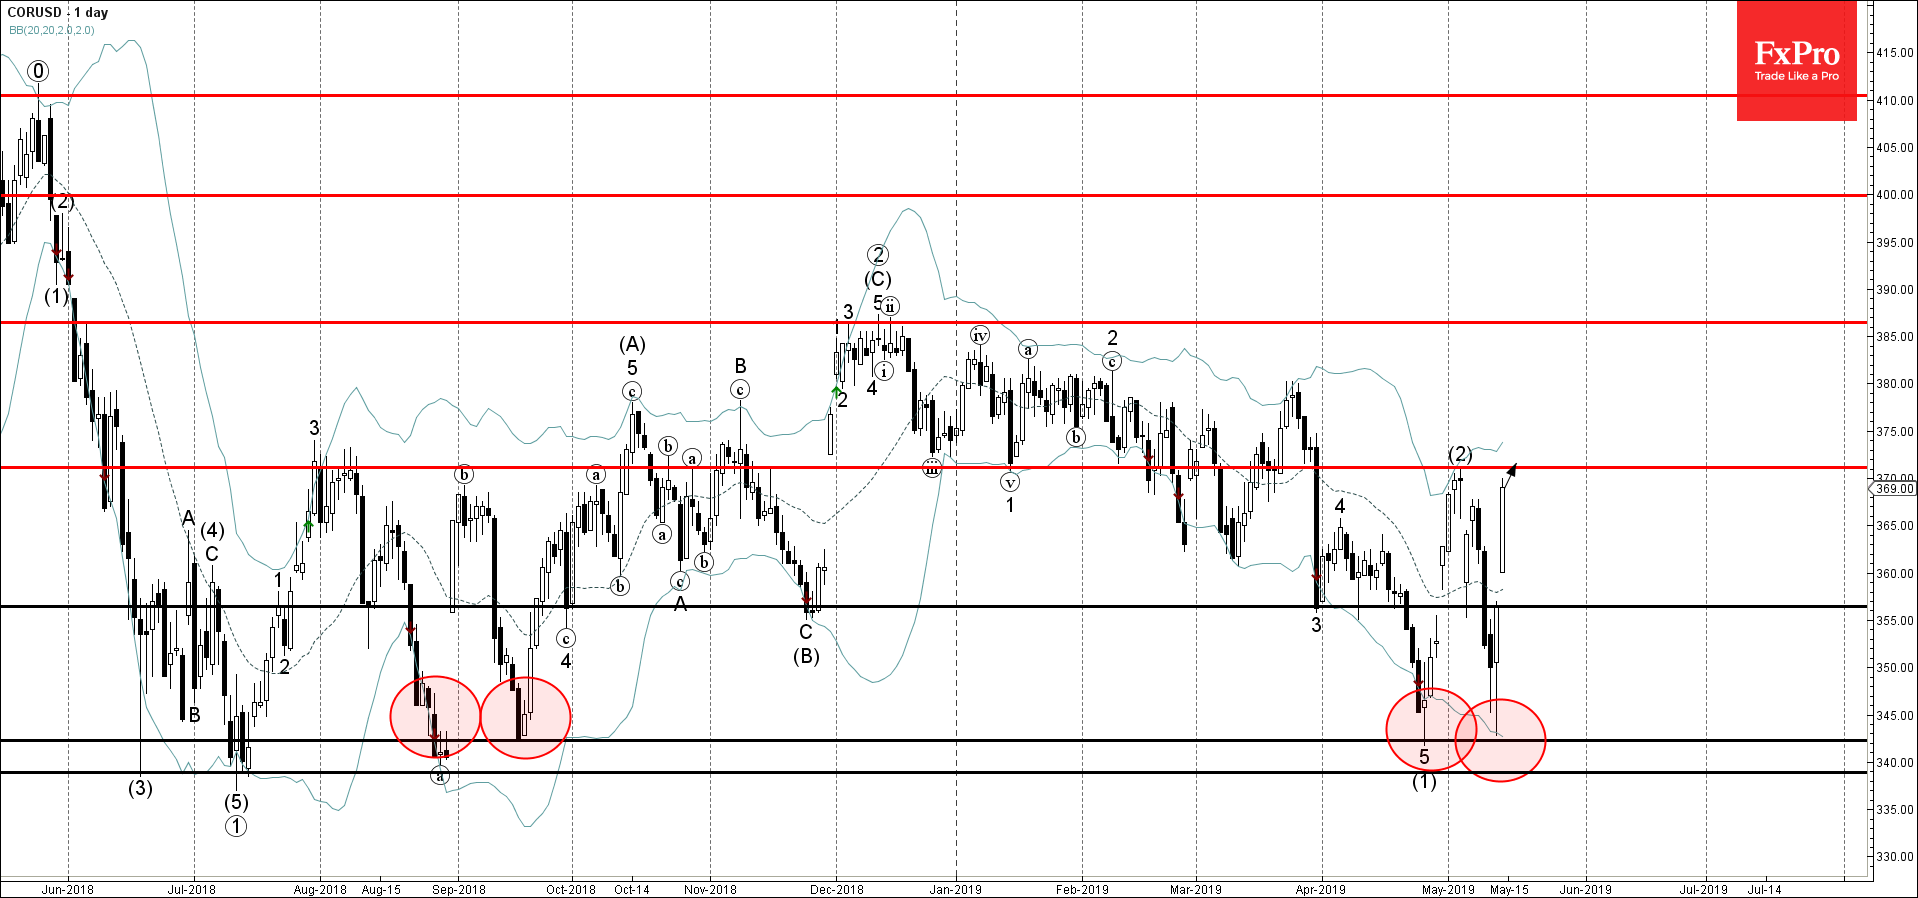
Corn recently reversed up from the support area lying between the support level 342.00 (which has been reversing the price from August) and the lower daily Bollinger Band.
The upward reversal from this support area created the daily Japanese candlesticks reversal pattern Bullish Engulfing.
Corn is expected to rise further and retest the next resistance level 371.20 (top of the previous ABC correction (2)).