Categories: Technical analysis

Corn Wave Analysis – 11 September, 2020

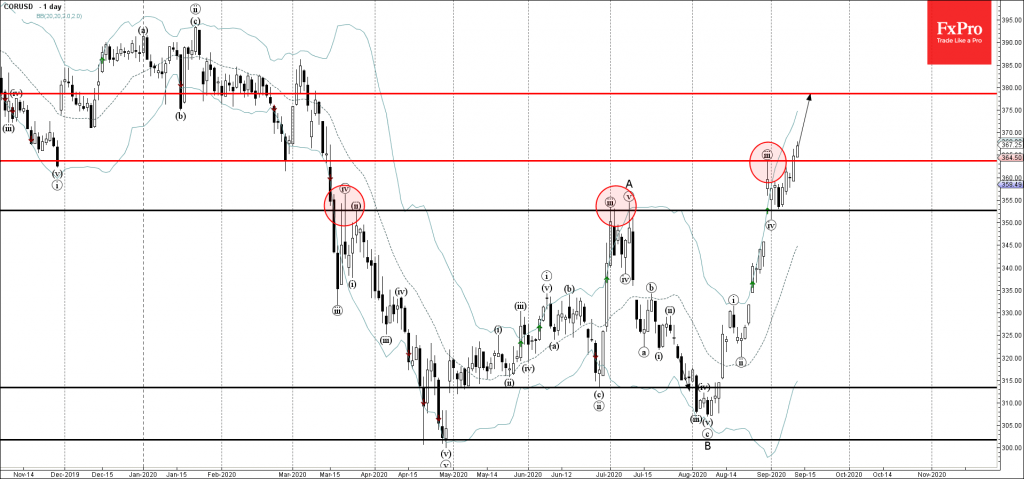
• Corn broke key resistance level 362.70

• Likely to rise to 370.00 and 380.00

Corn today broke above the key resistance level 362.70 (former powerful support from February and November) and the top of the previous impulse wave (iii)).

The breakout of the resistance level 362.70 should accelerate the active impulse wave (v) of the sharp impulse wave C from the start of August.

The aforementioned price level is acting as the support after it was broken. Corn is likely to rise further toward the next resistance levels at 370.00 and 380.00.

AddThis Website Tools
The FxPro Tech Analysis Team

The FxPro technical experts prepare a daily analysis of the most active currency pairs (majors, crosses, exotics) and commodities. Selected instruments are reviewed on daily trends (D1, H4), using the active Elliott Wave setups, Japanese candlesticks, indicators, and support/resistance levels.

Share
Published by
The FxPro Tech Analysis Team
Tags: CORUSD

Recent Posts

Adobe Wave Analysis – 13 March 2025

Adobe: ⬇️ Sell - Adobe broke round support level 400.00 - Likely to fall to…

21 minutes ago

Apple Wave Analysis – 13 March 2025

Apple: ⬇️ Sell - Apple broke support area - Likely to fall to support level…

22 minutes ago

Gold Wave Analysis – 13 March 2025

Gold: ⬆️ Buy - Gold broke resistance level 2962.00 - Likely to rise to resistance…

1 hour ago

EURGBP Wave Analysis – 13 March 2025

EURGBP: ⬇️ Sell - EURGBP reversed from key resistance level 0.8450 - Likely to fall…

1 hour ago

Gold climbs on lower rate speculations

The gold price has resumed updating its all-time highs on the back of speculations around…

7 hours ago

Crypto: just a bumpy downtrend

The crypto market experienced a drop, but towards the end of the week, there was…

8 hours ago