Categories: Technical analysis

Copper Wave Analysis 9 October, 2020

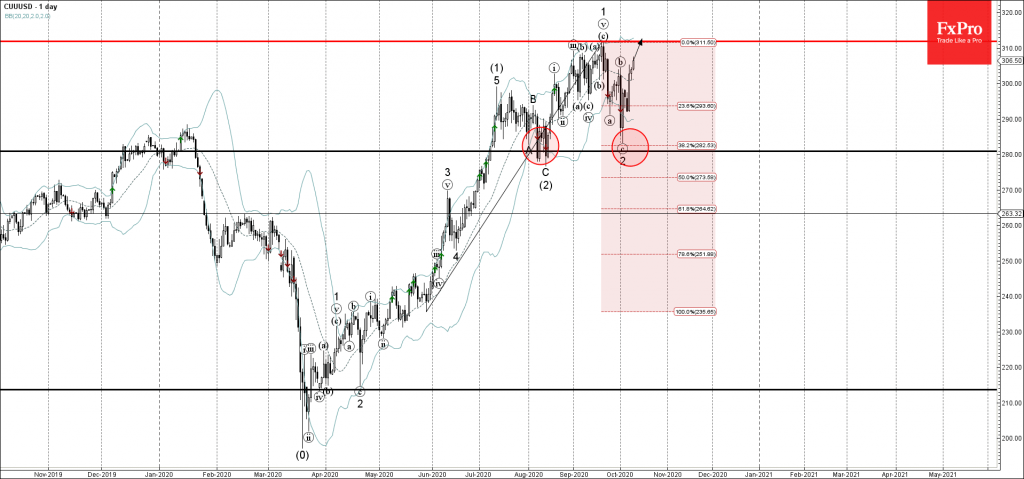
• Copper rising inside impulse wave 3

• Likely to test the resistance level 312.00

Copper continues to rise after the earlier sharp upward reversal from the support area located between the key support level 280.00, lower daily Bollinger Band and the 38.2% Fibonacci retracement of the earlier upward impulse from May.

The upward reversal from this support area started the active short-term impulse wave 3 belonging to the impulse sequence (3) from August.

Copper is likely to rise further toward the next resistance level 312.00 (top of the previous impulse wave 1 from September).

The FxPro Tech Analysis Team

The FxPro technical experts prepare a daily analysis of the most active currency pairs (majors, crosses, exotics) and commodities. Selected instruments are reviewed on daily trends (D1, H4), using the active Elliott Wave setups, Japanese candlesticks, indicators, and support/resistance levels.

Share
Published by
The FxPro Tech Analysis Team
Tags: CUUUSD

Recent Posts

Strong macro data and rate spreads are the USD’s main weapon

Strong US macro data and wide rate spreads boost the dollar, pressuring EURUSD and gold;…

3 hours ago

Top 10 Forex Trading Strategies

We have outlined the 10 best forex trading strategies with clear logic, real-world context, and…

4 hours ago

Bitcoin has not crossed the correction line

Bitcoin holds near $95.5K as the market steadies but hasn't confirmed a exit from correction…

4 hours ago

CHFJPY Wave Analysis – 15 January 2026

CHFJPY: ⬇️ Sell - CHFJPY reversed from resistance zone - Likely to fall to support level…

17 hours ago

WTI Crude Oil Wave Analysis – 15 January 2026

WTI Crude Oil: ⬇️ Sell - WTI Crude Oil rising inside minor impulse wave (1) -…

17 hours ago

Costco Wave Analysis – 15 January 2026

Costco: ⬆️ Buy - Costco rising inside minor impulse wave (1) - Likely to reach resistance…

17 hours ago

This website uses cookies