Categories: Technical analysis

Copper Wave Analysis – 30 October , 2018

  • Copper broke key support level 271.50
  • Further losses are likely

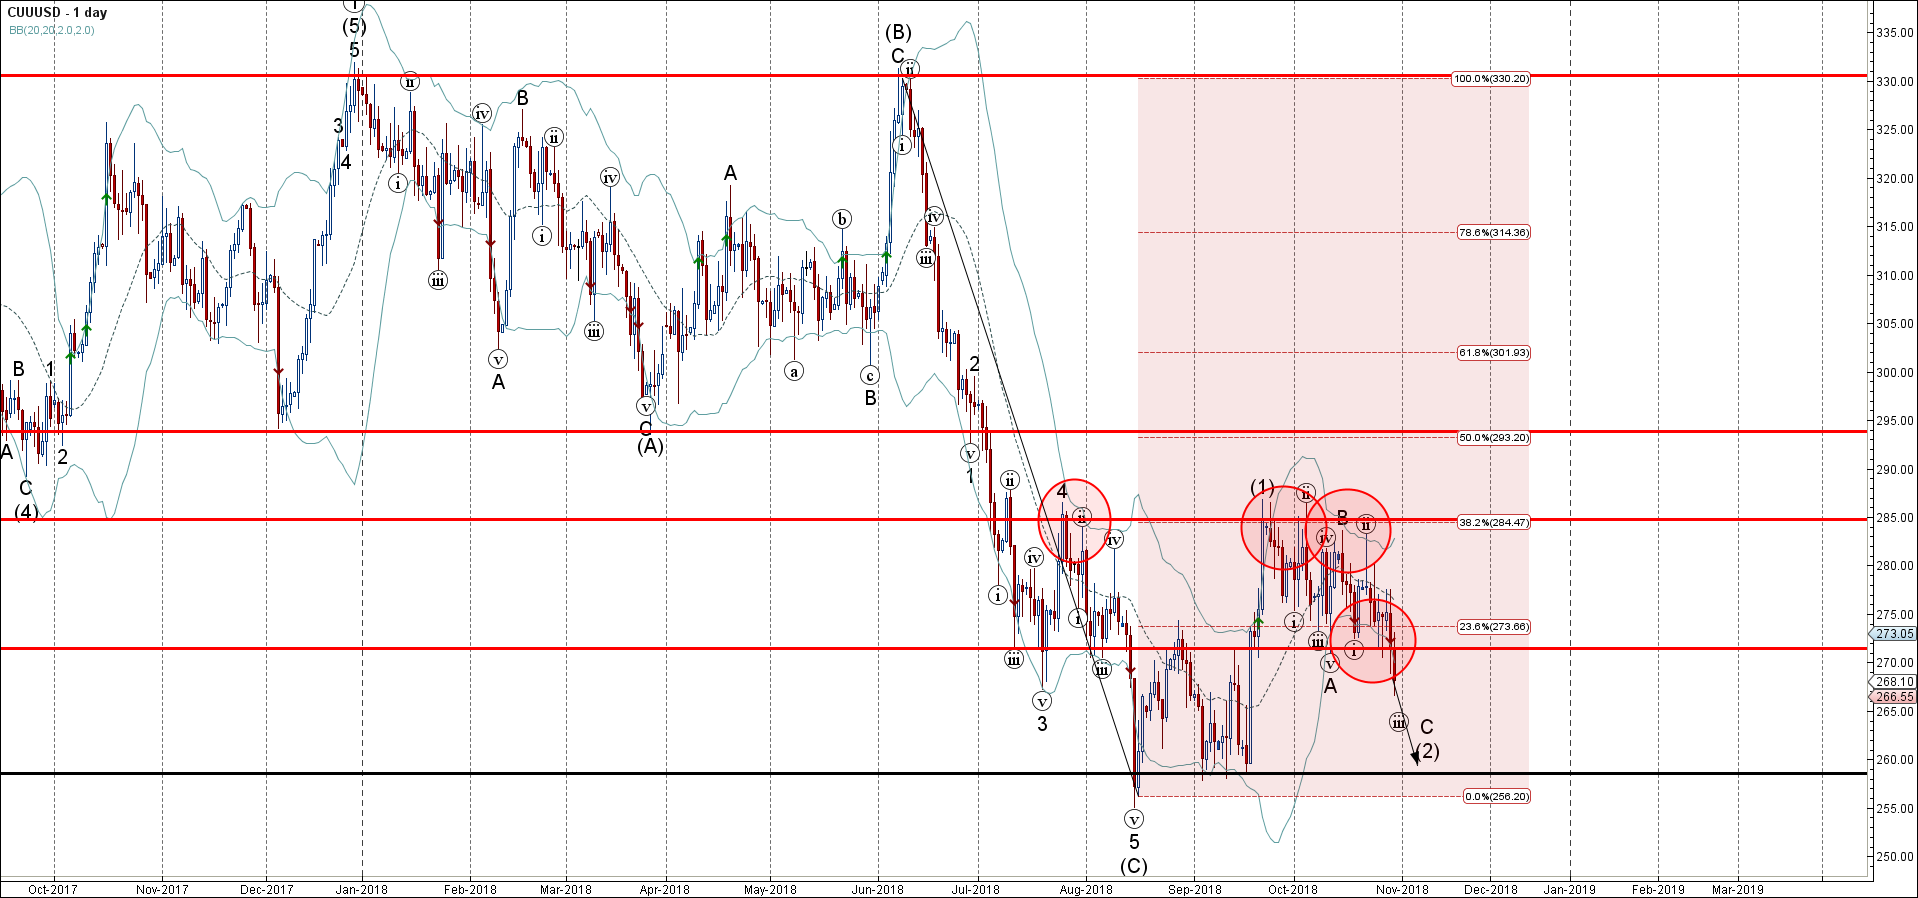
Copper recently broke through the key support level 271.50 (which has reversed the price multiple times from the start of October).

The breakout of the support level 271.50 continues the active short-term impulse wave C – which started previously from the powerful resistance level 285.00 – intersecting with the 38.2% Fibonacci correction of the weekly downward impulse (C) from July.

Copper is expected to fall further and re-test the next strong support level 260.00 (former strong support level from September).

AddThis Website Tools
The FxPro Tech Analysis Team

The FxPro technical experts prepare a daily analysis of the most active currency pairs (majors, crosses, exotics) and commodities. Selected instruments are reviewed on daily trends (D1, H4), using the active Elliott Wave setups, Japanese candlesticks, indicators, and support/resistance levels.

Share
Published by
The FxPro Tech Analysis Team
Tags: CUUUSD

Recent Posts

AMD Wave Analysis – 28 March 2025

AMD: ⬇️ Sell - AMD reversed from pivotal resistance level 115.00 - Likely to fall…

2 days ago

Google Wave Analysis – 28 March 2025

Google: ⬇️ Sell - Google broke key support level 160.00 - Likely to fall to…

2 days ago

Gold Wave Analysis – 28 March 2025

Gold: ⬆️ Buy - Gold broke resistance level 3050.00 - Likely to rise to resistance…

2 days ago

Ethereum Wave Analysis – 28 March 2025

Ethereum: ⬇️ Sell - Ethereum reversed from the resistance level 2120.00 - Likely to fall…

2 days ago

US inflation accelerates but lags income growth

US PCE inflation exceeded expectations at 2.8% in February. Income growth and savings rates remain…

2 days ago

What is next: Australia Rate, EU CPI, US NFP

Europe will switch to daylight saving time next week. Key events include the RBA's rate…

2 days ago