Categories: Technical analysis

Copper Wave Analysis – 18 October, 2021

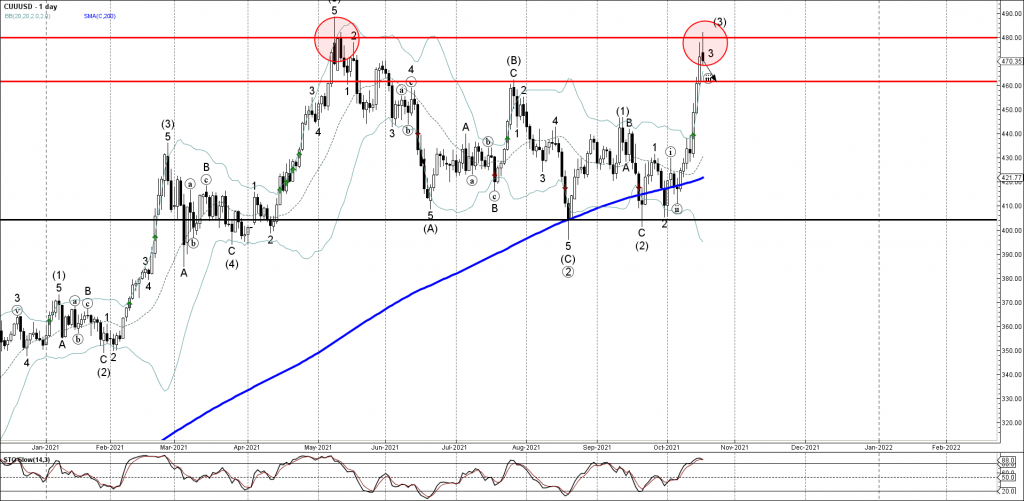
• Copper reversed from resistance area

• Likely to fall to support level 460,00

Copper recently reversed down from the resistance area lying between the multi-month resistance level 480,00 (which stopped the sharp uptrend in May) and the upper daily Bollinger Band,

The downward reversal from this resistance area stopped the previous impulse waves 3 and (3).

Given the strength of the aforementioned resistance area and the overbought daily Stochastic, Copper can be expected to fall further toward the next support level 460,00 (former key resistance from July).

The FxPro Tech Analysis Team

The FxPro technical experts prepare a daily analysis of the most active currency pairs (majors, crosses, exotics) and commodities. Selected instruments are reviewed on daily trends (D1, H4), using the active Elliott Wave setups, Japanese candlesticks, indicators, and support/resistance levels.

Share
Published by
The FxPro Tech Analysis Team
Tags: Copper

Recent Posts

Brent Crude oil Wave Analysis – 13 January 2026

Brent Crude oil ⬆️ Buy - Brent Crude oil rising inside impulse wave c -…

10 hours ago

USDJPY Wave Analysis – 13 January 2026

USDJPY ⬆️ Buy - USDJPY broke resistance area - Likely to rise to resistance level…

10 hours ago

Exxon Mobil Wave Analysis – 13 January 2026

Exxon Mobil ⬆️ Buy - Exxon Mobil broke resistance level 125.60 - Likely to rise…

10 hours ago

BNB Wave Analysis – 13 January 2026

Brent Crude oil ⬆️ Buy - BNB broke out of sideways price range - Likely…

10 hours ago

A slightly weaker CPI was not enough to break through the highs

US CPI data a bit softer than forecasts, sparking brief market optimism, but resistance remains.…

15 hours ago

Pro News Flash: Global Tensions Fuel a Fresh Oil Rally

🛢️ Oil prices are finding fresh strength as geopolitical tensions in the Middle East reignite…

16 hours ago

This website uses cookies