Categories: Technical analysis

Copper Wave Analysis – 11 September, 2020

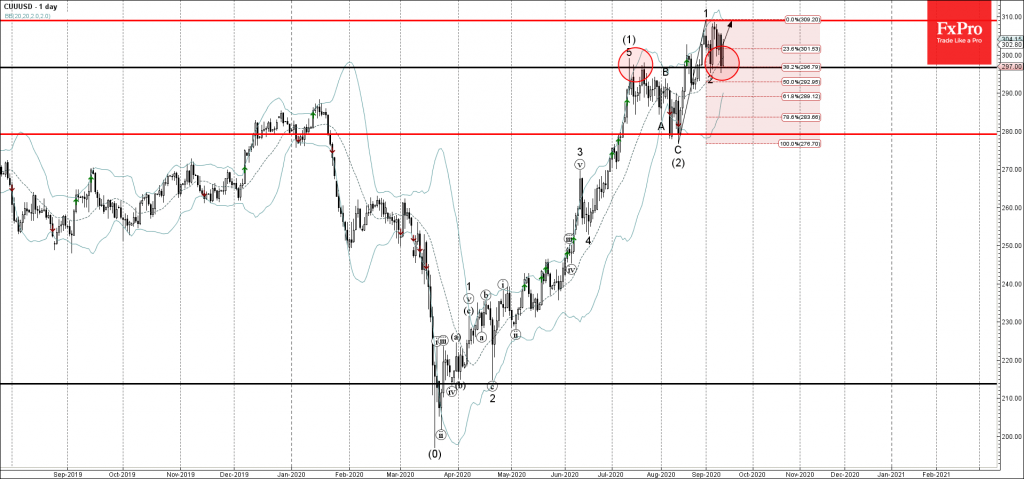
• Copper reversed from support level 296.00

• Likely to rise to 309.00

Copper toward reversed up once again from the key support level 296.00 (former powerful resistance from July which also stopped the previous wave 2 at the start of September).

The support zone near the support level 296.00 was strengthened by the 38.2% Fibonacci correction of the previous upward impulse wave 1 from the start of August.

Copper is likely to rise further toward the next resistance level 309.00 (top of the previous minor impulse wave 1).

The FxPro Tech Analysis Team

The FxPro technical experts prepare a daily analysis of the most active currency pairs (majors, crosses, exotics) and commodities. Selected instruments are reviewed on daily trends (D1, H4), using the active Elliott Wave setups, Japanese candlesticks, indicators, and support/resistance levels.

Share
Published by
The FxPro Tech Analysis Team
Tags: Copper

Recent Posts

Video: Dollar and Indices are trying to find footing after the fall

The dollar experienced a sell-off but rallied back up by the end of the week.…

2 days ago

What is next: BoJ, Fed, SNB & BoE Rates

The new week will be packed with economic data and decisions from key central banks.…

2 days ago

Dollar attempts to rebound after oversold conditions

Despite economic factors working against the dollar, its oversold condition helped it this week or…

2 days ago

USDCAD Wave Analysis – 14 March 2025

USDCAD: ⬇️ Sell - USDCAD reversed from key resistance level 1.4500 - Likely to fall…

2 days ago

Solana Wave Analysis – 14 March 2025

Solana: ⬆️ Buy - Solana reversed from the long-term support level 113.75 - Likely to…

2 days ago

Adobe Wave Analysis – 13 March 2025

Adobe: ⬇️ Sell - Adobe broke round support level 400.00 - Likely to fall to…

3 days ago

This website uses cookies