Categories: Technical analysis

Copper Wave Analysis – 09 November , 2018

  • Copper reversed from resistance area
  • Further losses are likely

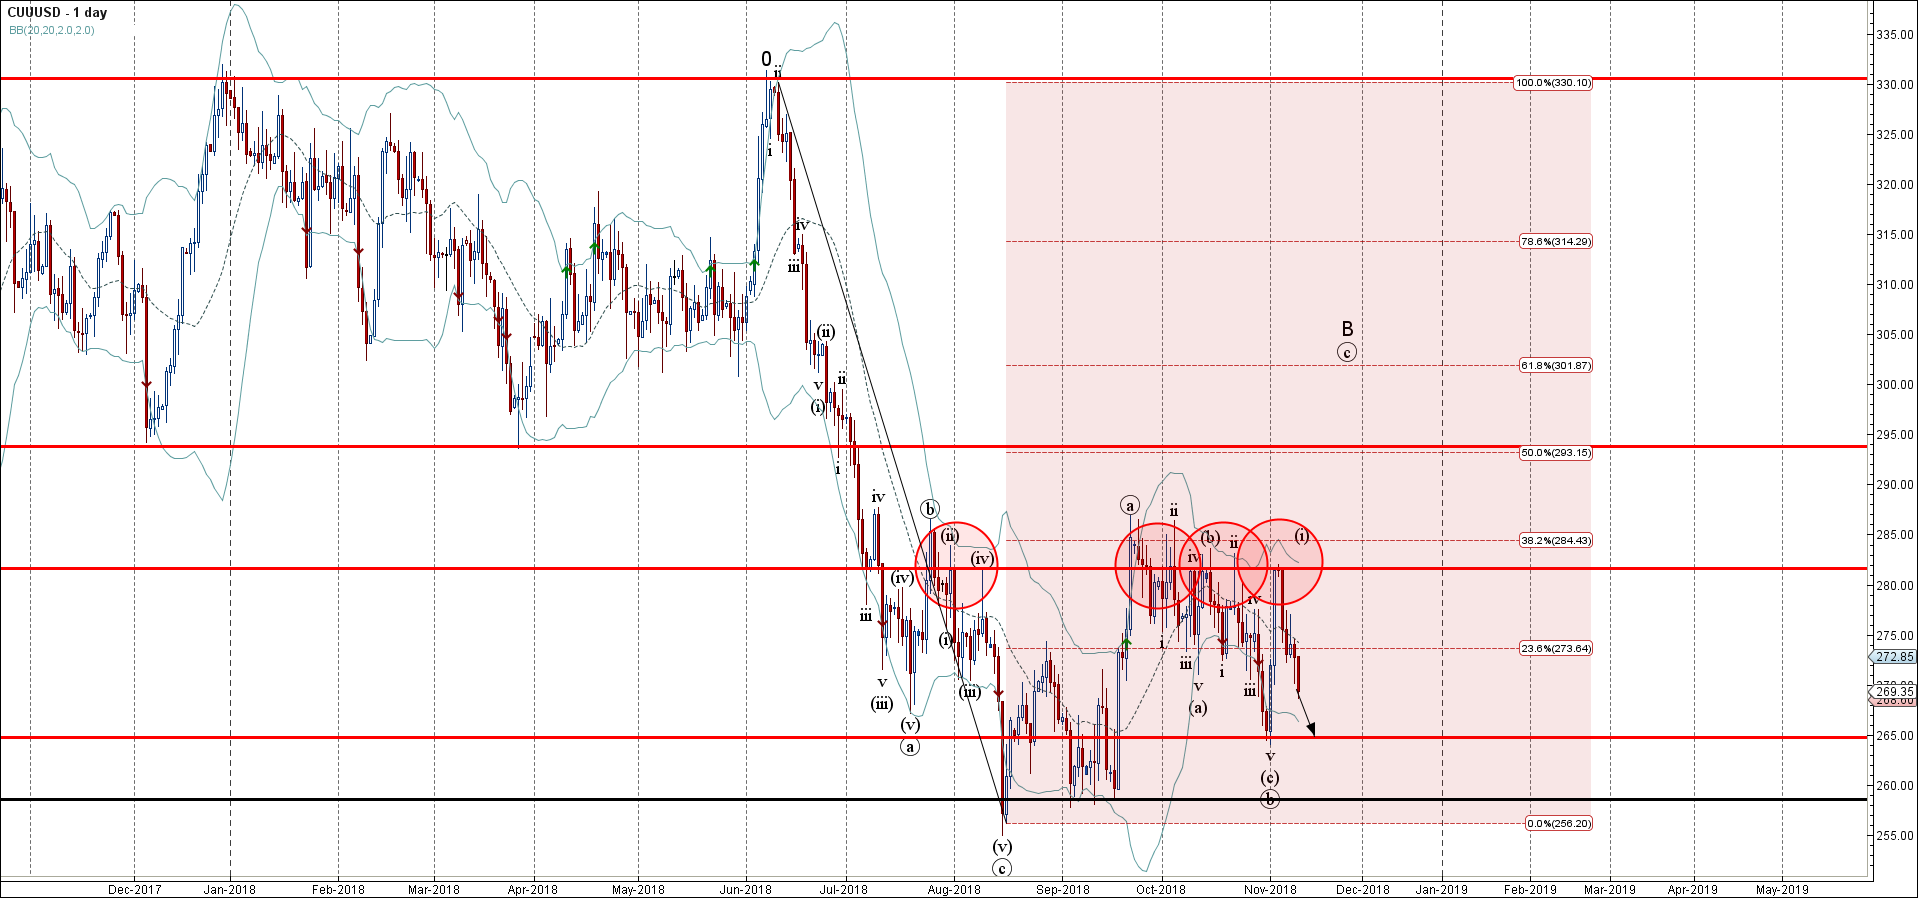
Copper has been falling in the last few trading sessions after the earlier downward reversal from the resistance area lying between the strong resistance level 282.00 (which has been reversing the price from August) and the upper daily Bollinger Band.

This resistance area was further strengthened by the 38.2% Fibonacci retracement of the previous sharp medium-term downward impulse wave from the start of June.

Copper is expected to fall further and re-test the next key support level 265.00 (low of the previous wave (b) from the end of Octobers).

AddThis Website Tools
The FxPro Tech Analysis Team

The FxPro technical experts prepare a daily analysis of the most active currency pairs (majors, crosses, exotics) and commodities. Selected instruments are reviewed on daily trends (D1, H4), using the active Elliott Wave setups, Japanese candlesticks, indicators, and support/resistance levels.

Share
Published by
The FxPro Tech Analysis Team
Tags: CUUUSD

Recent Posts

Video: Dollar and Indices are trying to find footing after the fall

The dollar experienced a sell-off but rallied back up by the end of the week.…

6 hours ago

What is next: BoJ, Fed, SNB & BoE Rates

The new week will be packed with economic data and decisions from key central banks.…

9 hours ago

Dollar attempts to rebound after oversold conditions

Despite economic factors working against the dollar, its oversold condition helped it this week or…

9 hours ago

USDCAD Wave Analysis – 14 March 2025

USDCAD: ⬇️ Sell - USDCAD reversed from key resistance level 1.4500 - Likely to fall…

10 hours ago

Solana Wave Analysis – 14 March 2025

Solana: ⬆️ Buy - Solana reversed from the long-term support level 113.75 - Likely to…

10 hours ago

Adobe Wave Analysis – 13 March 2025

Adobe: ⬇️ Sell - Adobe broke round support level 400.00 - Likely to fall to…

1 day ago