- Copper reversed from resistance zone
- Likely to fall to 251.00
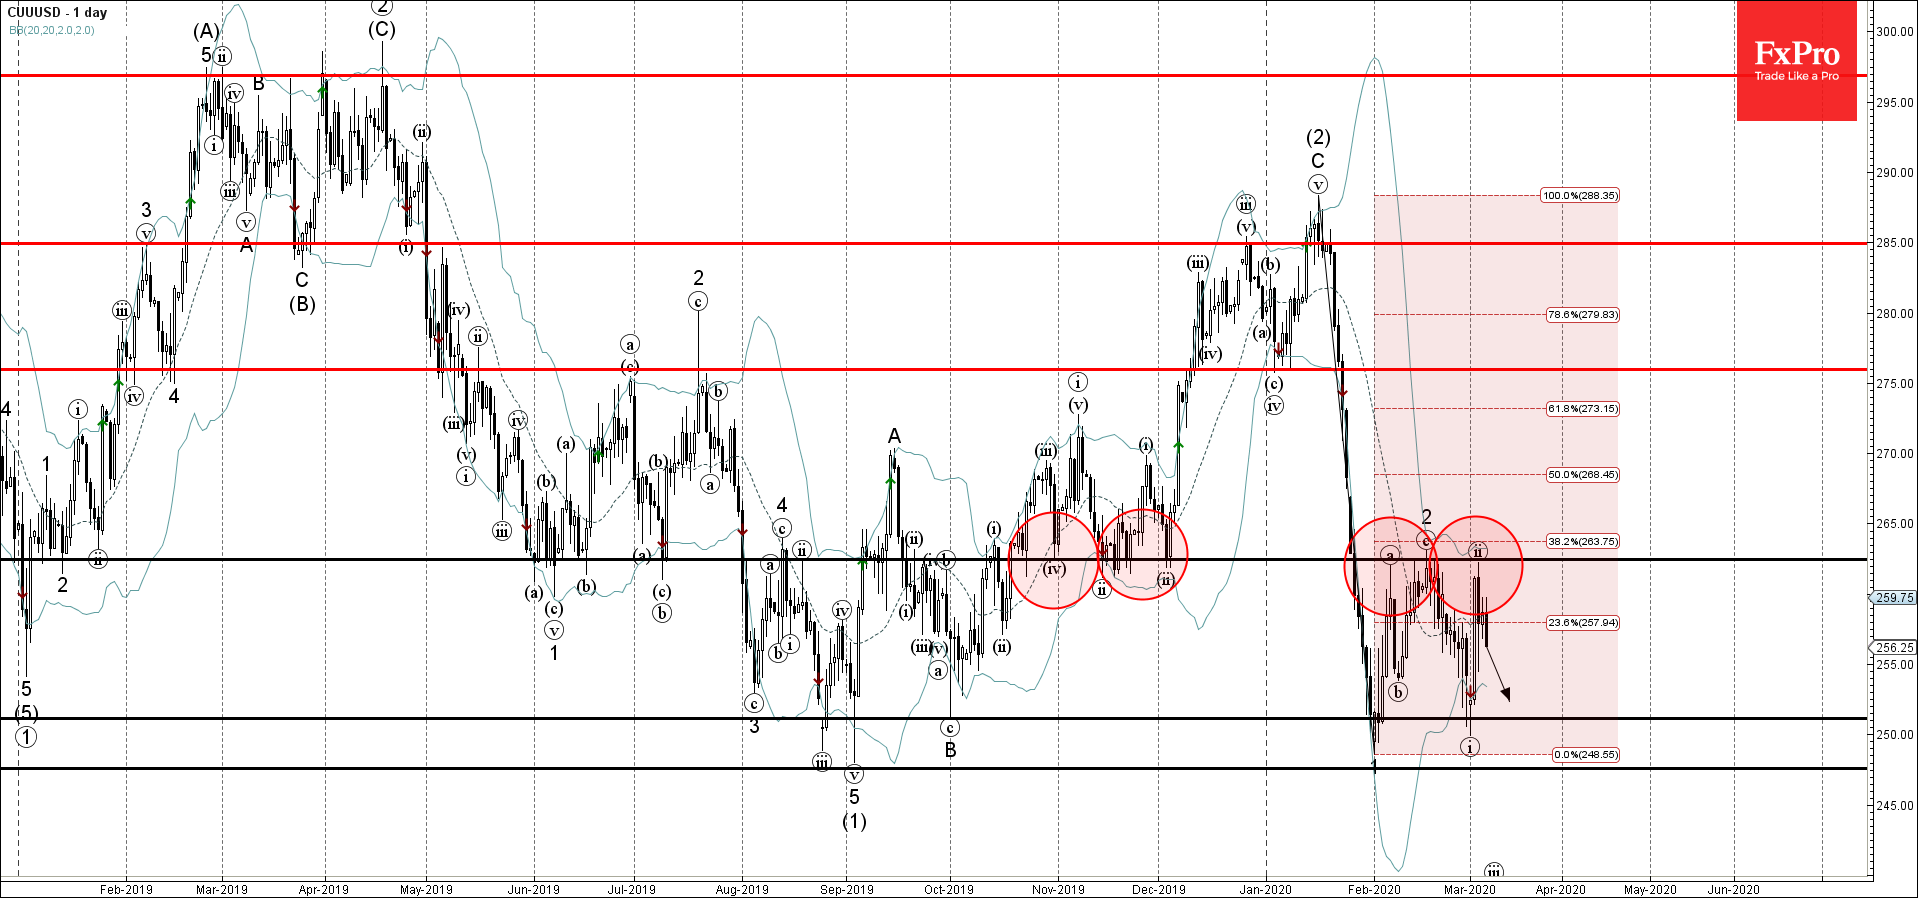
Copper recently reversed down fast from the resistance area located between the key resistance level 262.00 (former support from October and November), upper daily Bollinger Band and the 38.2% Fibonacci correction of the earlier downward impulse wave from January.
The downward reversal from this resistance zone started the active impulse wave (iii).
Copper is likely fall further toward the next support level 251.00 (which stopped the earlier impulse wave (i)).