Categories: Technical analysis

Copper (CUU) Wave Analysis – June 6, 2018

• Copper broke resistance zone • Further gains are likely

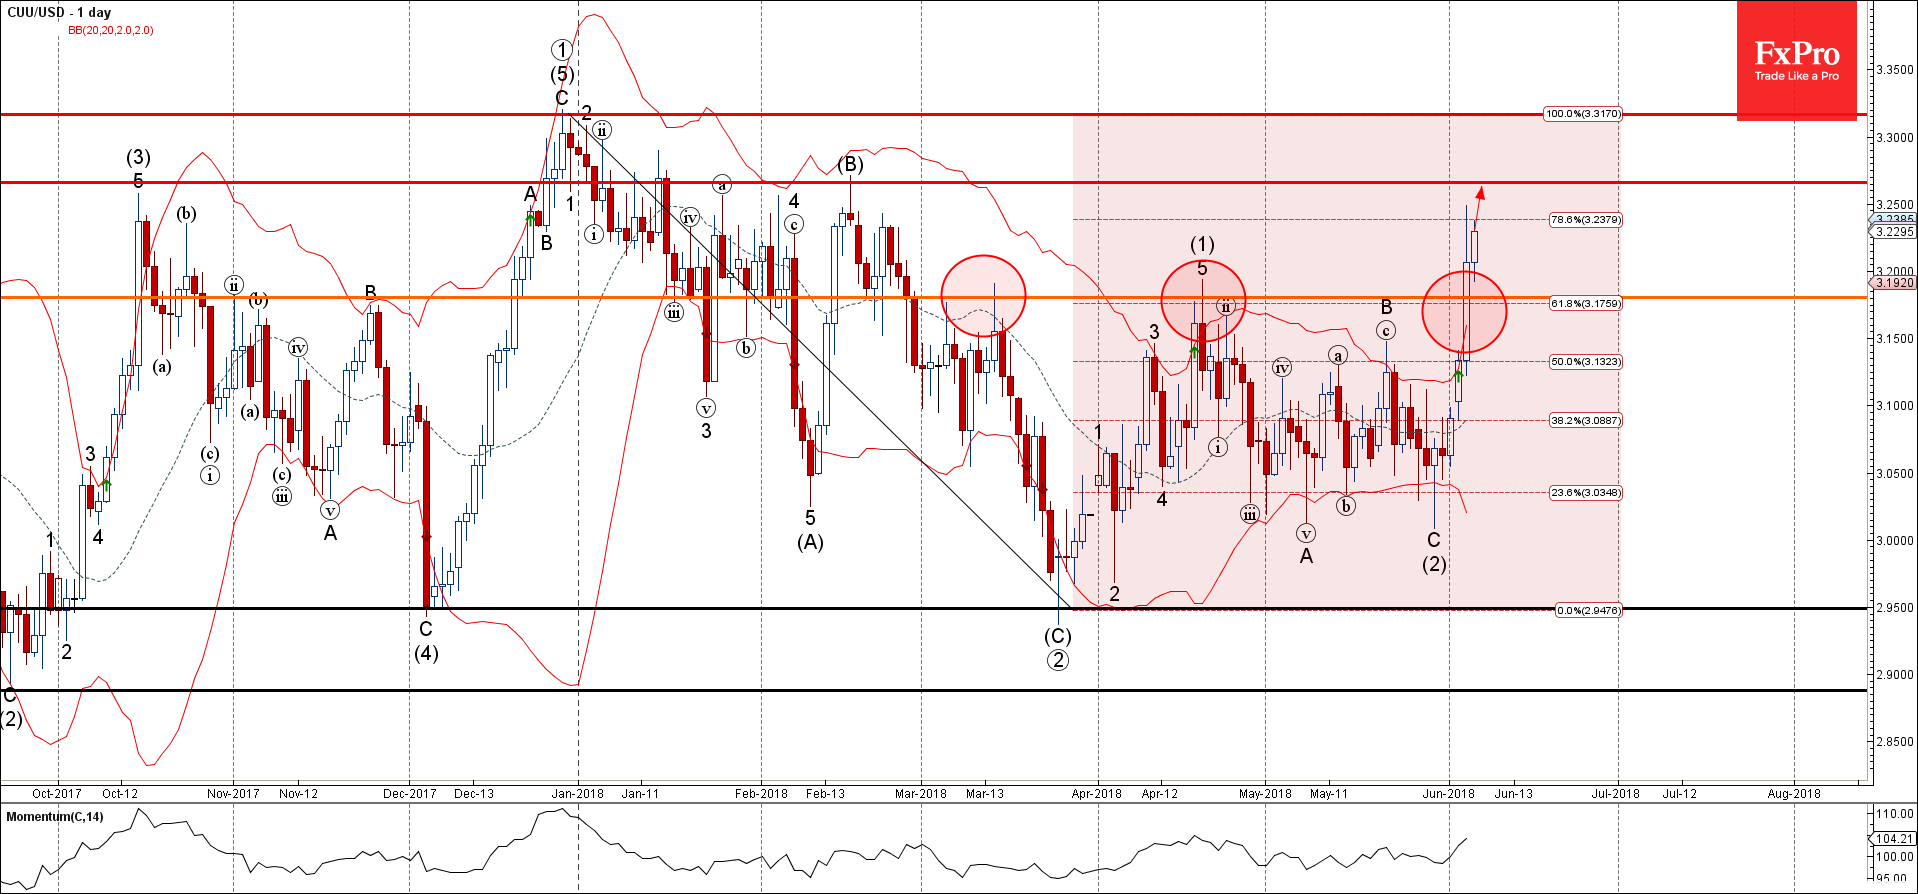
Copper recently broke the resistance zone located between the key resistance level 3.180 (which has been steadily reversing the price from the start of March) and the 61.8% Fibonacci correction of the previous downward correction from the end of December.

The breakout of this resistance strengthened the bullish pressure on Copper – accelerating the active medium-term impulse wave (3) from the end of May.

With the accelerating daily Momentum, Copper is expected to re-test the next prominent resistance level 3.2660 (which reversed the price numerous times from January).

The FxPro Analyst Team

Our team consists of financial market experts. Our dedicated professionals prepare reviews on the foreign exchange market situation, Crude Oil, Gold and Stock Indices. All the analysts are regularly published in the world leading economic media.

Share
Published by
The FxPro Analyst Team
Tags: Copper

Recent Posts

Adobe Wave Analysis 3 May 2024

- Adobe reversed from support zone - Likely to rise to resistance level 500.00 Adobe…

1 day ago

EURGBP Wave Analysis 3 May 2024

- EURJPY reversed from support zone - Likely to rise to resistance level 0.8625 EURGBP…

1 day ago

How Low Can the USDJPY Go?

USDJPY was slipping below 153 on Friday morning, a three-week low and having lost over…

2 days ago

Bitcoin’s Downtrend, Solana and Ethereum Form Double Bottom

Market picture  Crypto market capitalisation rose 3.3% in 24 hours to $2.22 trillion. Local capitalisation…

2 days ago

EURJPY Wave Analysis 2 May 2024

- EURJPY under strong bearish pressure - Likely to fall to support level 163.10 EURJPY…

2 days ago

WTI crude oil Wave Analysis 2 May 2024

- WTI broke round support level 80.00 - Likely to fall to support level 76.00…

2 days ago

This website uses cookies