Categories: Technical analysis

Comcast Wave Analysis 21 September, 2020

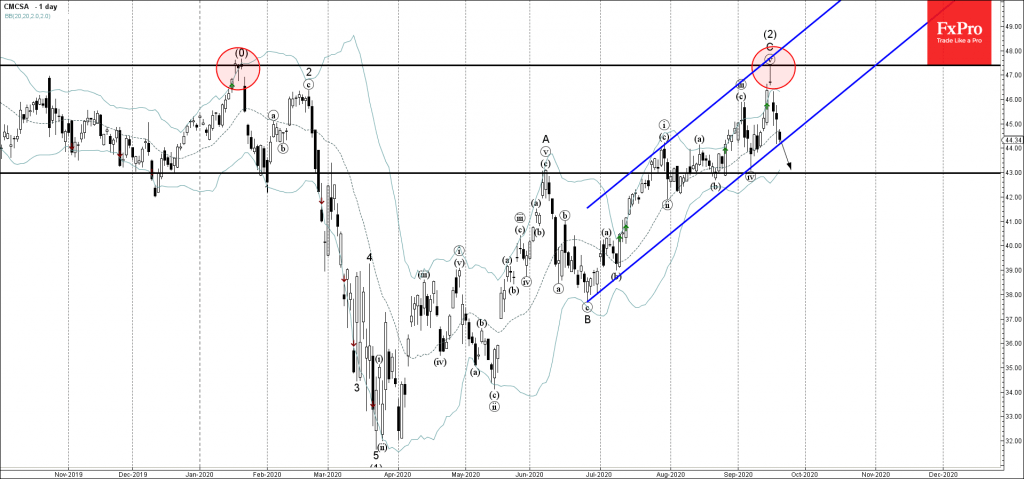
• Comcast falling inside impulse wave (3)

• Likely to reach 43.00

Comcast continues to fall inside the sharp impulse wave (3) , which started earlier from the resistance zone set between the multi-month resistance level 47.40 (January high) and resistance trendline of the daily up channel from June.

The downward reversal from this resistance zone created the beautiful daily reversal pattern Shooting Star Doji.

Comcast is expected to fall further toward the next support level 43.00 (low of the previous short-term correction (iv) from the start of September).

The FxPro Tech Analysis Team

The FxPro technical experts prepare a daily analysis of the most active currency pairs (majors, crosses, exotics) and commodities. Selected instruments are reviewed on daily trends (D1, H4), using the active Elliott Wave setups, Japanese candlesticks, indicators, and support/resistance levels.

Share
Published by
The FxPro Tech Analysis Team
Tags: CMCSA

Recent Posts

Bitcoin Wave Analysis – 14 January 2026

Bitcoin: ⬆️ Buy - Bitcoin broke resistance area - Likely to rise to resistance level…

14 hours ago

NZDJPY Wave Analysis – 14 January 2026

NZDJPY: ⬇️ Sell - NZDJPY reversed down from the resistance area - Likely to fall…

14 hours ago

What is Leverage?

Leverage is a mechanism that lets traders control larger positions using smaller capital. By choosing…

18 hours ago

The dollar does not tolerate dissent

US GDP growth is driven not by the White House, but by AI. The Bank…

24 hours ago

The crypto market has made a breakthrough

The crypto market surges, hitting new highs, with bullish sentiment for Bitcoin and Ethereum amid…

1 day ago

Brent Crude oil Wave Analysis – 13 January 2026

Brent Crude oil ⬆️ Buy - Brent Crude oil rising inside impulse wave c -…

2 days ago

This website uses cookies