Categories: Technical analysis

Coca-Cola Wave Analysis – 26 March, 2020

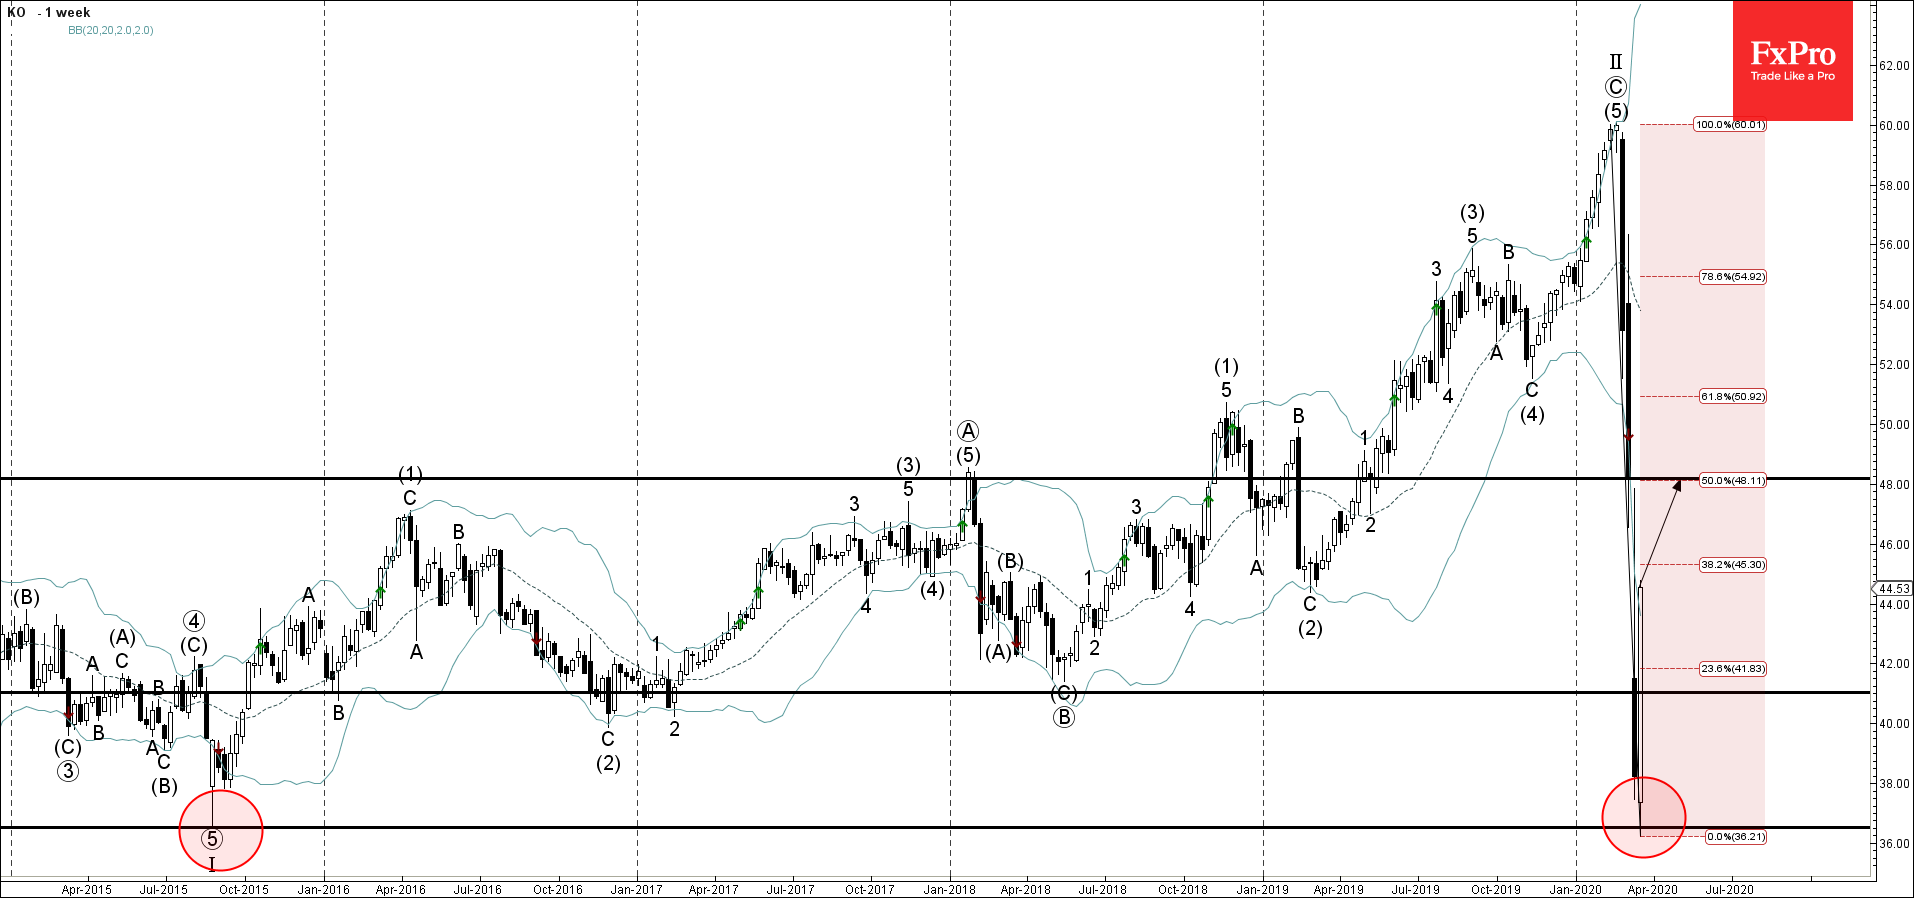
  • Coca-Cola reversed from major support zone
  • Likely to rise to 48.00

Coca-Cola recently reversed up sharply from the major support zone lying between the long-term support level 36.50 (yearly low from 2015) and the lower daily Bollinger Band.

The price then broke above the next resistance level 41.30 (former yearly low from 2018) – which accelerated the active upward correction.

Coca-Cola is likely to rise further toward the next resistance level 48.00 (50% Fibonacci retracement level of the previous sharp downward impulse from the end of February).

The FxPro Tech Analysis Team

The FxPro technical experts prepare a daily analysis of the most active currency pairs (majors, crosses, exotics) and commodities. Selected instruments are reviewed on daily trends (D1, H4), using the active Elliott Wave setups, Japanese candlesticks, indicators, and support/resistance levels.

Share
Published by
The FxPro Tech Analysis Team
Tags: KO

Recent Posts

Markets pick up signals from the White House

Donald Trump has no intention of dismissing Jerome Powell. The White House's decision to postpone…

1 hour ago

Nat Gas Current situation #tradelikeapro #tradingshort #tradingtips #gas #tradingstrategy #trading

Today is Thursday, January 15th. Once again we will talk about the gas market. The…

2 hours ago

Bitcoin aims to break out of a corrective rebound

Crypto market rebounds, Bitcoin eyes $100K, Dash surges, institutional demand rises, and Ethereum staking hits…

2 hours ago

Bitcoin Wave Analysis – 14 January 2026

Bitcoin: ⬆️ Buy - Bitcoin broke resistance area - Likely to rise to resistance level…

17 hours ago

NZDJPY Wave Analysis – 14 January 2026

NZDJPY: ⬇️ Sell - NZDJPY reversed down from the resistance area - Likely to fall…

17 hours ago

What is Leverage?

Leverage is a mechanism that lets traders control larger positions using smaller capital. By choosing…

21 hours ago

This website uses cookies