Categories: Technical analysis

Coca-Cola Wave Analysis – 19 June 2025

Coca-Cola: ⬇️ Sell

– Coca-Cola broke the support zone

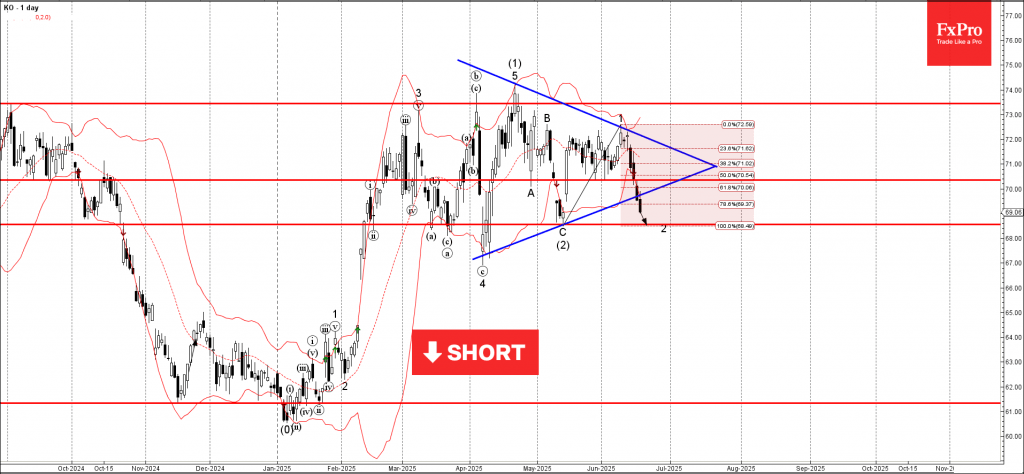
– Likely to fall to support level at 68.55

Coca-Cola recently broke the support zone located between the support level 70.35 (which reversed the price twice from May) and the 61.8% Fibonacci correction of the upward impulse 1 from May.

The breakout of this support zone coincided with the breakout of the daily Triangle from April – which accelerated the active correction 2.

Coca-Cola can be expected to fall to the next support level at 68.55 (former monthly low from May and the target for the completion of the active correction 2).

The FxPro Tech Analysis Team

The FxPro technical experts prepare a daily analysis of the most active currency pairs (majors, crosses, exotics) and commodities. Selected instruments are reviewed on daily trends (D1, H4), using the active Elliott Wave setups, Japanese candlesticks, indicators, and support/resistance levels.

Share
Published by
The FxPro Tech Analysis Team
Tags: coca-cola

Recent Posts

USDJPY. Current situation #tradelikeapro #tradingstrategy #trandingshorts #usdjpy #usdjpytoday

Today is Monday, December 15th, and we're going to talk about the Japanese yen, where…

2 hours ago

ECB, BoE, and BoJ take different paths

Trump pushes for more Fed rate cuts, while no changes are expected from the ECB…

5 hours ago

Crypto Market Holds at $3T Amid Broken Uptrend

Crypto market stays near $3T amid correction, ETF inflows rise, sentiment weakens, and volatility expected…

6 hours ago

Gold Wave Analysis – 12 December 2025

Gold: ⬇️ Sell - Gold reversed from strong resistance level 4350.00 - Likely to fall to…

3 days ago

EURGBP Wave Analysis – 12 December 2025

EURGBP: ⬆️ Buy - EURGBP reversed from support zone - Likely to rise to resistance level…

3 days ago

Filecoin Wave Analysis – 12 December 2025

Filecoin: ⬇️ Sell - Filecoin broke key support level 1.435 - Likely to fall to support…

3 days ago

This website uses cookies