Categories: Technical analysis

Coca-Cola Wave Analysis – 03 March, 2020

  • Coca-Cola rising inside impulse wave 1
  • Likely to rise to 391.00

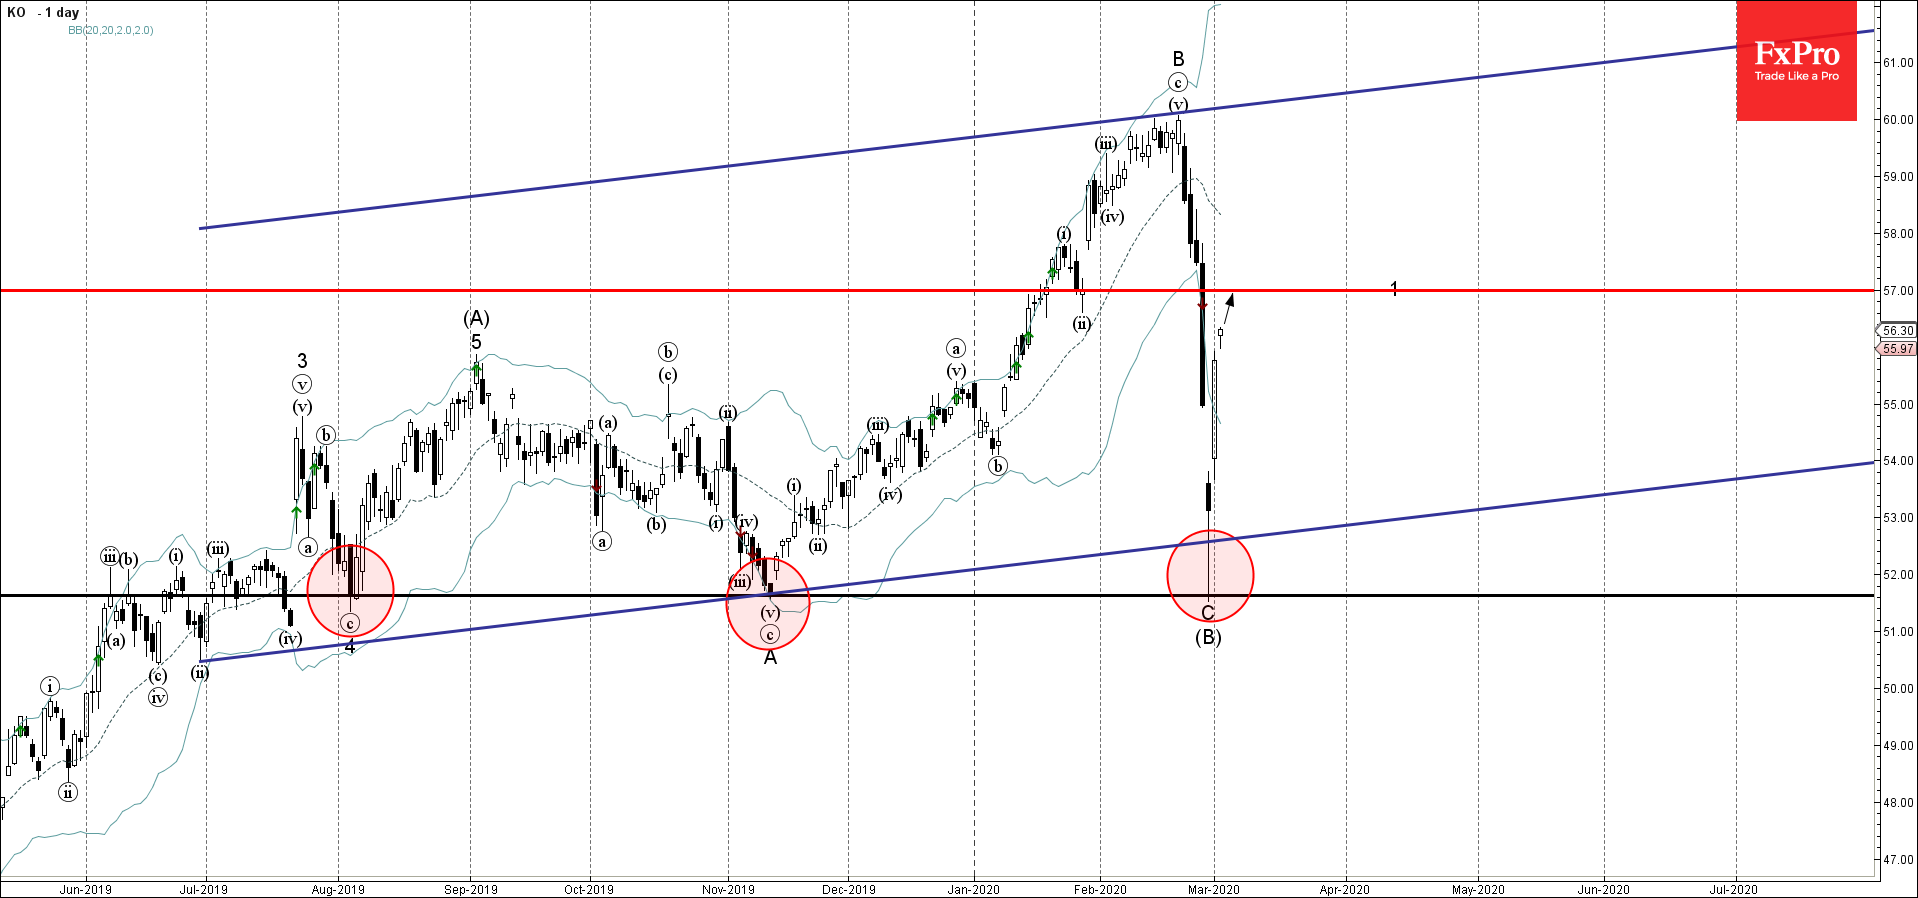
Coca-Cola recently reversed up powerfully from the support area lying between the long-term support level 51.60 (which has been reversing the price from August) and the lower daily Bollinger Band.

The upward reversal from this support zone created the daily Japanese candlesticks reversal pattern Hammer- which started the active impulse wave 1.

Coca-Cola is likely to extend the gains further toward the next resistance level 57.00 (former support from January and the target for the completion of the active impulse wave 1).

The FxPro Tech Analysis Team

The FxPro technical experts prepare a daily analysis of the most active currency pairs (majors, crosses, exotics) and commodities. Selected instruments are reviewed on daily trends (D1, H4), using the active Elliott Wave setups, Japanese candlesticks, indicators, and support/resistance levels.

Share
Published by
The FxPro Tech Analysis Team
Tags: KO

Recent Posts

Nikkei 225 index Wave Analysis 20 September 2024

- Nikkei 225 index rising inside minor impulse waves 3 - Likely to reach resistance…

7 hours ago

NZDJPY Wave Analysis 20 September 2024

- NZDJPY rising inside corrective wave ii - Likely to rise to resistance level 91.65…

7 hours ago

Gold terminates the last sceptics

Gold started the week with new highs and ended the week up 1.3%, despite a…

13 hours ago

The Crypto Market’s Steady Ascent

Crypto market cap rose by 3.2% to $2.21 trillion overnight. This made the struggle to…

19 hours ago

Gold Wave Analysis 19 September 2024

- Gold reversed from support level 2550.00 - Likely to rise to resistance level 2600.00…

1 day ago

S&P 500 Wave Analysis 19 September 2024

- S&P 500 broke key resistance level 5670.00 - Likely to rise to resistance level…

1 day ago

This website uses cookies