Categories: Technical analysis

Citigroup Wave Analysis 16 April 2024

– Citigroup falling inside minor impulse wave 1

– Likely to fall to support level 54.80

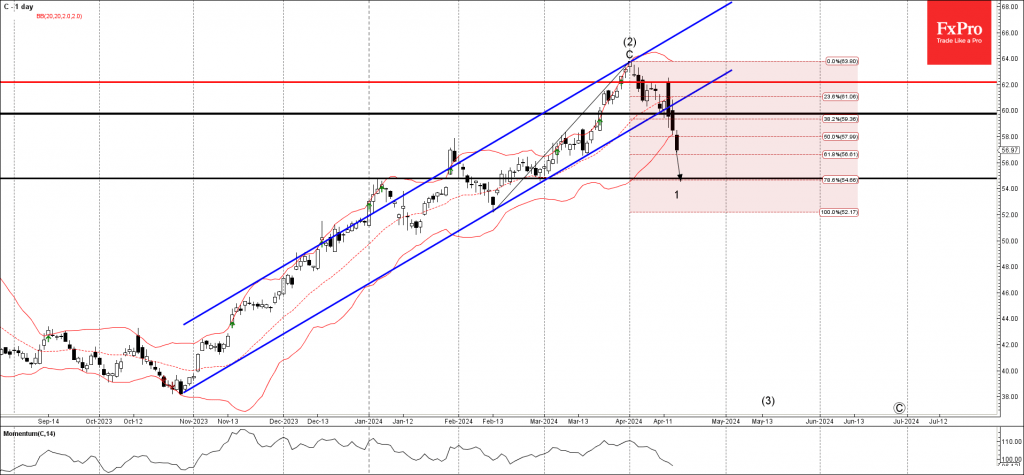
Citigroup falling inside the sharp minor impulse wave 1 of the intermediate impulse wave (3) from the end of March.

The price earlier broke the round support level 60.00 coinciding with the support trendline of the extended up channel from and the 38.2% Fibonacci correction of the upward impulse from February.

Given the strength of the active impulse wave 1, Citigroup can be expected to fall further to the next support level 54.80 (former support from February).

The FxPro Tech Analysis Team

The FxPro technical experts prepare a daily analysis of the most active currency pairs (majors, crosses, exotics) and commodities. Selected instruments are reviewed on daily trends (D1, H4), using the active Elliott Wave setups, Japanese candlesticks, indicators, and support/resistance levels.

Share
Published by
The FxPro Tech Analysis Team
Tags: Citigroup

Recent Posts

Solana Wave Analysis – 5 December 2025

Solana: ⬇️ Sell - Solana reversed from resistance zone - Likely to fall to support…

2 hours ago

EURAUD Wave Analysis – 5 December 2025

EURAUD : ⬇️ Sell - EURAUD broke the support level 1.7600 - Likely to fall…

2 hours ago

Forex has set its priorities

In 2026, experts favour the yen, see modest euro growth, and expect pressure on the…

6 hours ago

Bear market rebound in crypto is likely to continue

Crypto rebounds continue; Bitcoin faces resistance, with a mixed market outlook ahead, as regulatory changes…

7 hours ago

Coca-Cola Wave Analysis – 4 December 2025

Coca-Cola: ⬇️ Sell - Coca-Cola reversed from long-term resistance level 73.25 - Likely to fall to…

20 hours ago

DraftKings Wave Analysis – 4 December 2025

DraftKings: ⬆️ Buy - DraftKings reversed from support zone - Likely to rise to resistance level…

20 hours ago

This website uses cookies