Categories: Technical analysis

Citibank Wave Analysis – 21 August, 2020

• Citibank reversed from support zone

• Likely to rise to 55.00

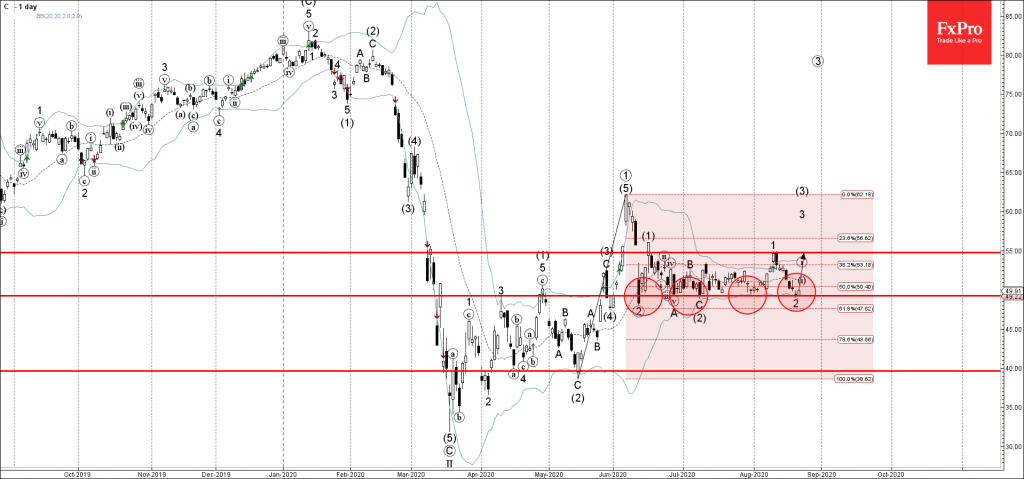
Citibank today reversed up from the support zone located between the pivotal support level 49.20 (former resistance from April).

The support zone near the support level 49.20 is strengthened by the lower daily Bollinger Band and by the 50% Fibonacci correction of the upward impulse from May.

Citibank is likely to rise further toward the next resistance level 55.00 (top of the previous short-term impulse wave 3).

AddThis Website Tools
The FxPro Tech Analysis Team

The FxPro technical experts prepare a daily analysis of the most active currency pairs (majors, crosses, exotics) and commodities. Selected instruments are reviewed on daily trends (D1, H4), using the active Elliott Wave setups, Japanese candlesticks, indicators, and support/resistance levels.

Share
Published by
The FxPro Tech Analysis Team

Recent Posts

NIO Wave Analysis – 31 March 2025

NIO: ⬆️ Buy - NIO reversed from support zone - Likely to rise to resistance…

7 hours ago

Nvidia Wave Analysis – 31 March 2025

Nvidia: ⬆️ Buy - Nvidia reversed from key support level 105.00 - Likely to rise…

7 hours ago

Markets rattled on consumer sentiment

Consumer sentiment index from the University of Michigan shows alarming information for stock indices, with…

14 hours ago

EURAUD Wave Analysis – 31 March 2025

EURAUD: ⬆️ Buy - EURAUD rising inside impulse wave iii - Likely to reach resistance…

14 hours ago

USDCAD Wave Analysis – 31 March 2025

USDCAD: ⬆️ Buy - USDCAD reversed from the support zone - Likely to rise to…

14 hours ago
Video Pro News Weekly: Market Shake-Up. USD Struggles & Crypto’s Next Big Move!Video Pro News Weekly: Market Shake-Up. USD Struggles & Crypto’s Next Big Move!

Video Pro News Weekly: Market Shake-Up. USD Struggles & Crypto’s Next Big Move!

Major market shifts underway! The US dollar hits resistance, stocks teeter on tariff tensions, and…

19 hours ago