Categories: Technical analysis

Cisco Systems Wave Analysis 19 March, 2021

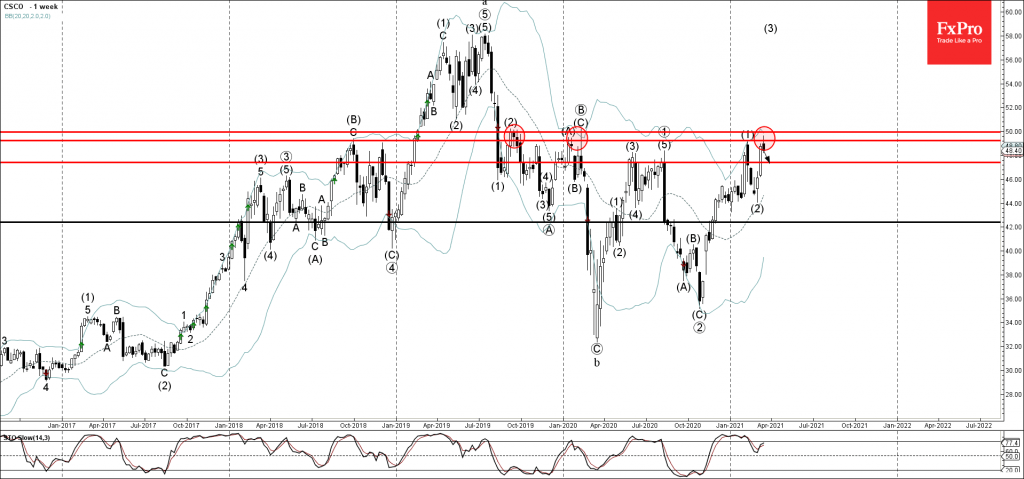
• Cisco Systems reversed from long-term resistance level 50.00

• Likely to fall to support level 47.40

Cisco Systems under bearish pressure after the price reversed down from the long-term resistance level 50.00 (which has been reversing the price from the end for 2019) – standing close to the upper weekly Bollinger Band.

The downward reversal from the resistance level 50.00 stopped the previous medium-term impulse wave (3).

Given the strength of the resistance level 50.00 , clear bearish divergence on the weekly Stochastic indicator – Cisco Systems is likely to fall further toward the next support level 47.40.

The FxPro Tech Analysis Team

The FxPro technical experts prepare a daily analysis of the most active currency pairs (majors, crosses, exotics) and commodities. Selected instruments are reviewed on daily trends (D1, H4), using the active Elliott Wave setups, Japanese candlesticks, indicators, and support/resistance levels.

Share
Published by
The FxPro Tech Analysis Team
Tags: CSCO

Recent Posts

The dollar does not tolerate dissent

US GDP growth is driven not by the White House, but by AI. The Bank…

7 hours ago

The crypto market has made a breakthrough

The crypto market surges, hitting new highs, with bullish sentiment for Bitcoin and Ethereum amid…

8 hours ago

Brent Crude oil Wave Analysis – 13 January 2026

Brent Crude oil ⬆️ Buy - Brent Crude oil rising inside impulse wave c -…

21 hours ago

USDJPY Wave Analysis – 13 January 2026

USDJPY ⬆️ Buy - USDJPY broke resistance area - Likely to rise to resistance level…

21 hours ago

Exxon Mobil Wave Analysis – 13 January 2026

Exxon Mobil ⬆️ Buy - Exxon Mobil broke resistance level 125.60 - Likely to rise…

21 hours ago

BNB Wave Analysis – 13 January 2026

Brent Crude oil ⬆️ Buy - BNB broke out of sideways price range - Likely…

21 hours ago

This website uses cookies