Categories: Technical analysis

ChinaA50 Wave Analysis 12 October, 2020

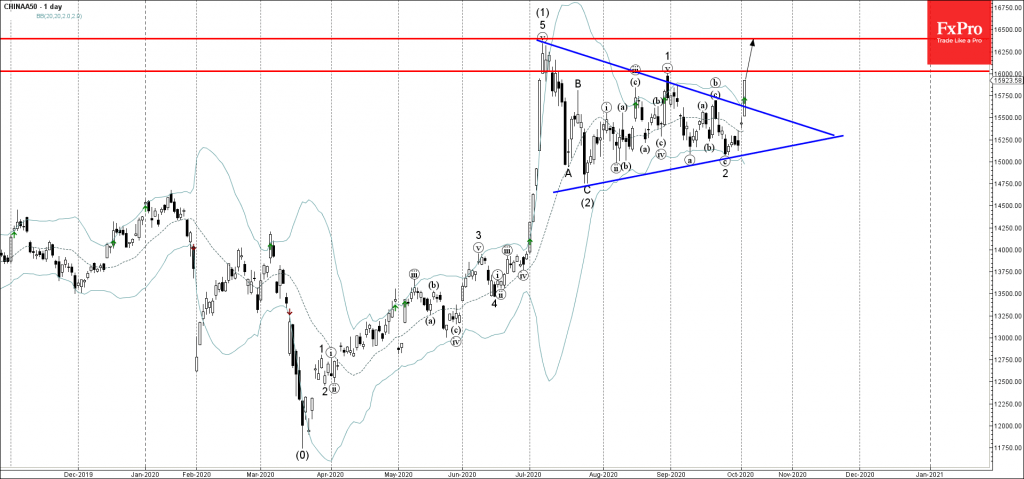
• ChinaA50 broke daily Triangle

• Likely to rise to 16400.00

ChinaA50 recently broke the resistance trendline of the daily Triangle from July – which accelerated the active impulse wave 3.

The price is currently trading near the key round resistance level 16000.00 (top of wave 1 from August).

If the price is able to break above the resistance level 16000.00 – ChinaA50 will then, most likely, rise to the next powerful resistance level 16400.00 (multi-month high from the start of July).

The FxPro Tech Analysis Team

The FxPro technical experts prepare a daily analysis of the most active currency pairs (majors, crosses, exotics) and commodities. Selected instruments are reviewed on daily trends (D1, H4), using the active Elliott Wave setups, Japanese candlesticks, indicators, and support/resistance levels.

Share
Published by
The FxPro Tech Analysis Team
Tags: chinaA50

Recent Posts

AUDJPY Wave Analysis – 5 December 2025

AUDJPY: ⬆️ Buy - AUDJPY broke long-term resistance level 102.30 - Likely to rise to…

1 day ago

Aptos Wave Analysis – 5 December 2025

Aptos: ⬇️ Sell - Aptos testing major support at 1.688 - Likely to fall to…

1 day ago

Pro News Weekly: Market Shake-Up, Dollar Drops, Gold Surges, Bitcoin Wobbles!

Welcome to Pro News Flash! 💵 The U.S. dollar slips 🏆 Major stock indices struggle…

1 day ago

Solana Wave Analysis – 5 December 2025

Solana: ⬇️ Sell - Solana reversed from resistance zone - Likely to fall to support…

1 day ago

EURAUD Wave Analysis – 5 December 2025

EURAUD : ⬇️ Sell - EURAUD broke the support level 1.7600 - Likely to fall…

1 day ago

Forex has set its priorities

In 2026, experts favour the yen, see modest euro growth, and expect pressure on the…

2 days ago

This website uses cookies