Categories: Technical analysis

CHFJPY Wave Analysis – 8 July, 2020

• CHFJPY approached multi-month resistance level 114.60

• Likely to correct down to 114.00

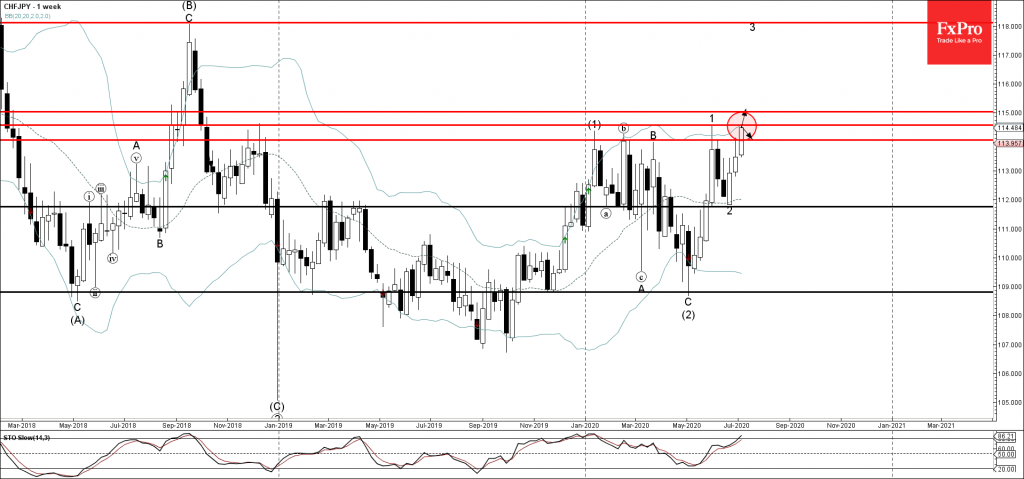
CHFJPY recently rose sharply and is currently trading near the powerful multi-month resistance level 114.60 (which has been reversing the price from the end of 2018, as can be seen below).

The resistance zone near the resistance level 114.60 is strengthened by the upper weekly Bollinger band.

Given the overbought weekly Stochastic – CHFJPY might correct down from the current levels toward the next support level 114.00. If the pair breaks above 114.60 – CHFJPY should then test next resistance at 115.00.

The FxPro Tech Analysis Team

The FxPro technical experts prepare a daily analysis of the most active currency pairs (majors, crosses, exotics) and commodities. Selected instruments are reviewed on daily trends (D1, H4), using the active Elliott Wave setups, Japanese candlesticks, indicators, and support/resistance levels.

Share
Published by
The FxPro Tech Analysis Team
Tags: CHFJPY

Recent Posts

CHFJPY Wave Analysis – 9 January 2026

CHFJPY: ⬆️ Buy - CHFJPY reversed from support area - Likely to rise to resistance…

3 days ago

Exxon Mobil Wave Analysis – 9 January 2026

Exxon Mobil: ⬆️ Buy - Exxon Mobil reversed from support area - Likely to rise…

3 days ago

Pro News Weekly: Dollar Rebounds as Markets Test New Limits

Welcome to Pro News Weekly! Here’s what is shaping the markets: 💵 The U.S. dollar…

3 days ago

Geopolitics will destroy the euro

•    EURUSD falls due to geopolitics and expectations of tariff removal •    Gold returns to…

3 days ago

Platinum Wave Analysis – 8 January 2026

Platinum: ⬇️ Sell - Platinum reversed from pivotal resistance level 150.00 - Likely to fall to…

4 days ago

Baidu Wave Analysis – 8 January 2026

Baidu: ⬇️ Sell - Baidu reversed from resistance zone - Likely to fall to support level…

4 days ago

This website uses cookies