Categories: Technical analysis

CHFJPY Wave Analysis – 5 June, 2020

• CHFJPY reversed from resistance area

• Likely to fall to 113.25

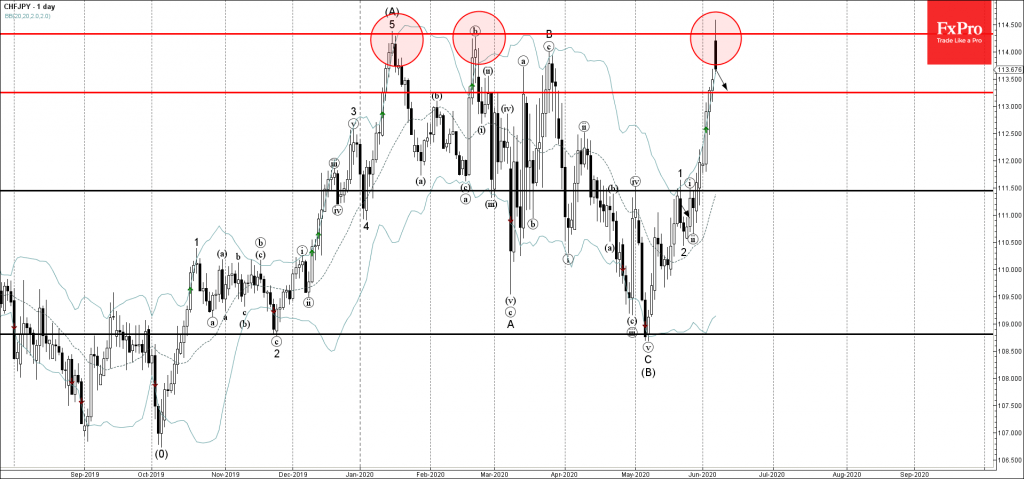
CHFJPY recently reversed down sharply from the strong resistance area lying between the major resistance level 114.30 (monthly high from January and February) and the upper daily Bollinger Band.

The downward reversal from this resistance area stopped the previous short-term impulse wave 3 from the end of May.

Given the strength of the aforementioned resistance area – CHFJPY is likely to fall further toward the next support level 113.25.

AddThis Website Tools
The FxPro Tech Analysis Team

The FxPro technical experts prepare a daily analysis of the most active currency pairs (majors, crosses, exotics) and commodities. Selected instruments are reviewed on daily trends (D1, H4), using the active Elliott Wave setups, Japanese candlesticks, indicators, and support/resistance levels.

Share
Published by
The FxPro Tech Analysis Team
Tags: CHFJPY

Recent Posts

Ethereum gives way

The crypto market remains in a downtrend, with Ethereum losing market share while Bitcoin's share…

3 hours ago

GBPUSD Wave Analysis – 18 March 2025

GBPUSD: ⬆️ Buy - GBPUSD reversed from support zone - Likely to rise to resistance…

16 hours ago

GBPAUD Wave Analysis – 18 March 2025

GBPAUD: ⬆️ Buy - GBPAUD reversed from the support zone - Likely to rise to…

16 hours ago

Solana Wave Analysis – 18 March 2025

Solana: ⬇️ Sell - Solana reversed from the resistance zone - Likely to fall to…

18 hours ago

CHFJPY Wave Analysis – 18 March 2025

CHFJPY: ⬆️ Buy - CHFJPY broke resistance zone - Likely to rise to resistance level…

18 hours ago

The crypto market is stuck in the mud

Market Picture The crypto market has been hovering in a narrow range for the past…

23 hours ago