Categories: Technical analysis

CHFJPY Wave Analysis 29 December, 2020

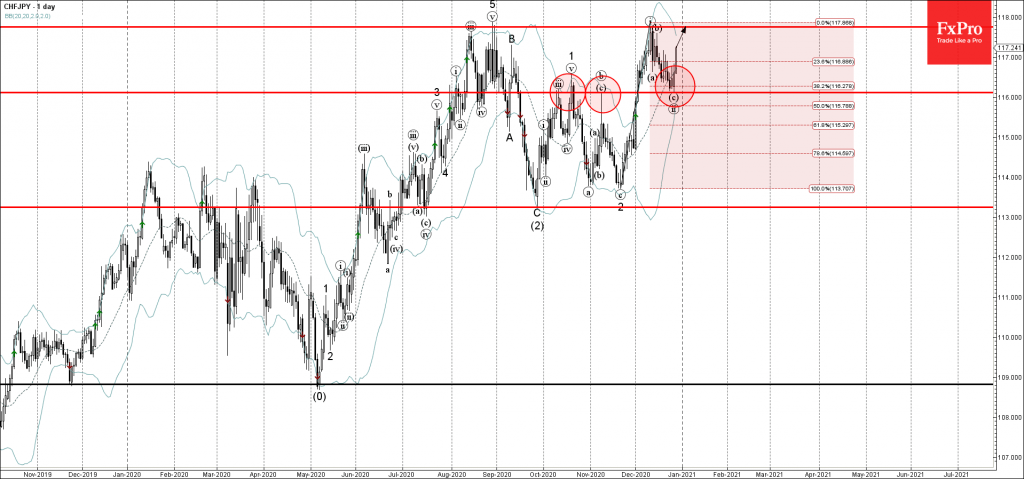
• CHFJPY reversed from support level 116.10

• Likely to rise to 117.75

CHFJPY recently reversed up sharply from the key support level 116.10 (former monthly high from November) – standing near the lower daily Bollinger Band and the 38.2 Fibonacci correction of the previous upward impulse wave (i).

The upward reversal from the support level 116.10 started the active short-term impulse wave (iii) – which belongs to waves 3 and (3) – from November and September respectively.

Given the clear CHF bullishness seen today – CHFJPY is expected to rise further toward the next resistance level 117.75 (top of the previous impulse waves 5 and (i)).

The FxPro Tech Analysis Team

The FxPro technical experts prepare a daily analysis of the most active currency pairs (majors, crosses, exotics) and commodities. Selected instruments are reviewed on daily trends (D1, H4), using the active Elliott Wave setups, Japanese candlesticks, indicators, and support/resistance levels.

Share
Published by
The FxPro Tech Analysis Team
Tags: CHFJPY

Recent Posts

Bitcoin Wave Analysis – 14 January 2026

Bitcoin: ⬆️ Buy - Bitcoin broke resistance area - Likely to rise to resistance level…

7 hours ago

NZDJPY Wave Analysis – 14 January 2026

NZDJPY: ⬇️ Sell - NZDJPY reversed down from the resistance area - Likely to fall…

7 hours ago

What is Leverage?

Leverage is a mechanism that lets traders control larger positions using smaller capital. By choosing…

12 hours ago

The dollar does not tolerate dissent

US GDP growth is driven not by the White House, but by AI. The Bank…

18 hours ago

The crypto market has made a breakthrough

The crypto market surges, hitting new highs, with bullish sentiment for Bitcoin and Ethereum amid…

18 hours ago

Brent Crude oil Wave Analysis – 13 January 2026

Brent Crude oil ⬆️ Buy - Brent Crude oil rising inside impulse wave c -…

1 day ago

This website uses cookies