Categories: Technical analysis

CHFJPY Wave Analysis 17 December, 2020

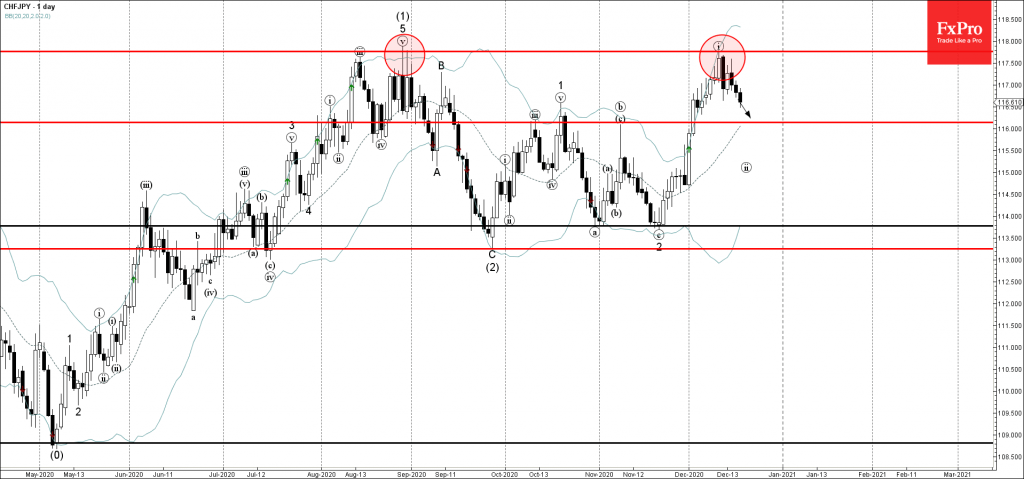
• CHFJPY reversed from major resistance level 117.75

• Likely to fall to 116.15

CHFJPY recently reversed down with the daily Japanese candlesticks reversal pattern Bearish Engulfing from the major resistance level 117.75 (former monthly high from August) – standing near the upper daily Bollinger Band.

The upward reversal form the resistance level 117.75 started the active short-term correction (ii).

CHFJPY is expected to fall further toward the next support level 116.15 (top of the previous corrective wave (b) from the start of November).

The FxPro Tech Analysis Team

The FxPro technical experts prepare a daily analysis of the most active currency pairs (majors, crosses, exotics) and commodities. Selected instruments are reviewed on daily trends (D1, H4), using the active Elliott Wave setups, Japanese candlesticks, indicators, and support/resistance levels.

Share
Published by
The FxPro Tech Analysis Team
Tags: CHFJPY

Recent Posts

Bitcoin Wave Analysis – 14 January 2026

Bitcoin: ⬆️ Buy - Bitcoin broke resistance area - Likely to rise to resistance level…

6 minutes ago

NZDJPY Wave Analysis – 14 January 2026

NZDJPY: ⬇️ Sell - NZDJPY reversed down from the resistance area - Likely to fall…

7 minutes ago

The dollar does not tolerate dissent

US GDP growth is driven not by the White House, but by AI. The Bank…

10 hours ago

The crypto market has made a breakthrough

The crypto market surges, hitting new highs, with bullish sentiment for Bitcoin and Ethereum amid…

11 hours ago

Brent Crude oil Wave Analysis – 13 January 2026

Brent Crude oil ⬆️ Buy - Brent Crude oil rising inside impulse wave c -…

1 day ago

USDJPY Wave Analysis – 13 January 2026

USDJPY ⬆️ Buy - USDJPY broke resistance area - Likely to rise to resistance level…

1 day ago

This website uses cookies