Categories: Technical analysis

CHFJPY Wave Analysis – 15 June, 2020

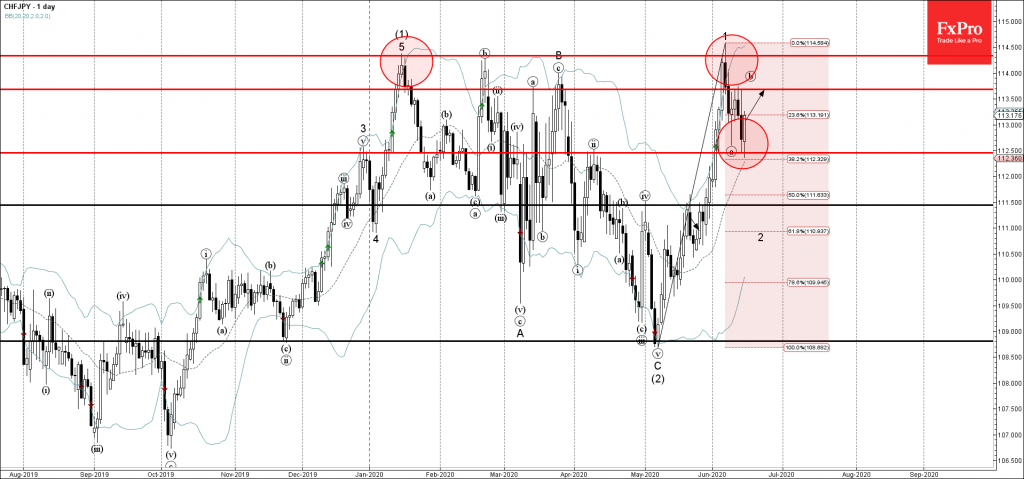
• CHFJPY reversed from support zone

• Likely to rise to 113.70

CHFJPY recently reversed up from the support area lying between the key support level 112.5 (former monthly high from April) and the 38.2% Fibonacci correction of the previous upward impulse wave 1.

The upward reversal from this support zone stopped the earlier short-term corrective wave (a).

CHFJPY is likely to rise further toward the next resistance level 113.70 (top of the previous 4 consecutive candles).

AddThis Website Tools
The FxPro Tech Analysis Team

The FxPro technical experts prepare a daily analysis of the most active currency pairs (majors, crosses, exotics) and commodities. Selected instruments are reviewed on daily trends (D1, H4), using the active Elliott Wave setups, Japanese candlesticks, indicators, and support/resistance levels.

Share
Published by
The FxPro Tech Analysis Team
Tags: CHFJPY

Recent Posts

Bitcoin on the Verge of a Breakout?

BTC is testing key resistance, big investors are buying in, and even Peter Schiff is…

1 hour ago

Netflix Wave Analysis – 25 March 2025

Netflix: ⬆️ Buy - Netflix broke resistance zone - Likely to rise to resistance level 1050.00…

9 hours ago

Goldman Sachs Wave Analysis – 25 March 2025

Goldman Sachs: ⬆️ Buy - Goldman Sachs continues daily uptrend - Likely to rise to…

9 hours ago

Nasdaq-100 Wave Analysis – 25 March 2025

Nasdaq-100: ⬆️ Buy - Nasdaq-100 broke resistance zone - Likely to rise to resistance level…

11 hours ago

Gold Wave Analysis – 25 March 2025

Gold: ⬆️ Buy - Gold reversed from support zone - Likely to rise to the…

11 hours ago

US Consumers Lose Confidence Over Trade Tariffs

US Consumer Confidence Index has dropped to a four-year low due to fears of tariff…

17 hours ago