Categories: Technical analysis

CHFJPY Wave Analysis 11 October 2024

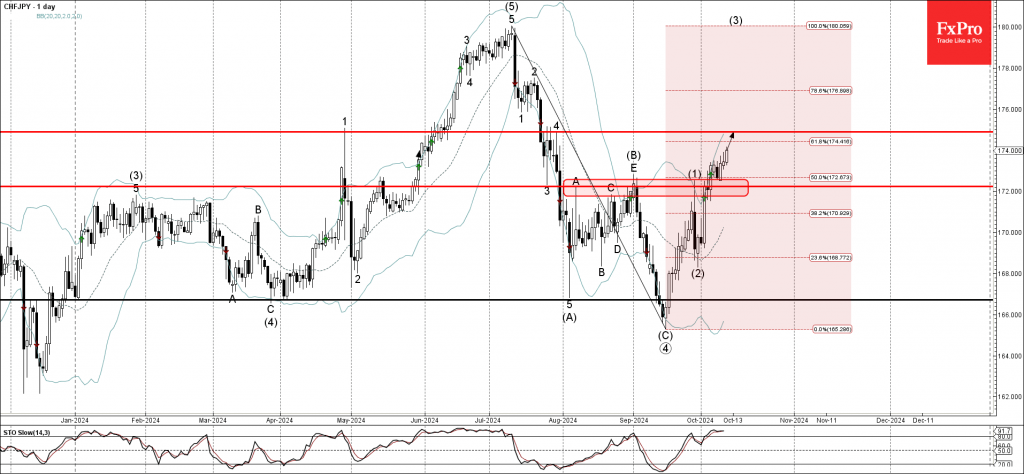
– CHFJPY broke resistance zone

– Likely to rise to resistance level 174.90

CHFJPY currency pair under the bullish pressure after the earlier breakout of the resistance zone located between the key resistance level 172.00 (which stopped the previous waves A, C,E and (1)) and the 50% Fibonacci correction of the primary downward correction 4 from July.

The breakout of this resistance zone accelerated the active intermediate impulse sequence (3) from the end of September.

Given the rising bullish Swiss franc sentiment, CHFJPY currency pair be expected to rise further to the next resistance level 174.90.

The FxPro Tech Analysis Team

The FxPro technical experts prepare a daily analysis of the most active currency pairs (majors, crosses, exotics) and commodities. Selected instruments are reviewed on daily trends (D1, H4), using the active Elliott Wave setups, Japanese candlesticks, indicators, and support/resistance levels.

Share
Published by
The FxPro Tech Analysis Team
Tags: CHFJPY

Recent Posts

EURAUD Wave Analysis – 6 January 2026 Wave Analysis – 6 January 2026

EURAUD: ⬇️ Sell - EURAUD broke strong support level 1.7465 - Likely to fall to…

32 minutes ago

IBM Wave Analysis – 6 January 2026

IBM: ⬆️ Buy - IBM reversed from support zone - Likely to rise to resistance…

33 minutes ago

Palladium Wave Analysis – 6 January 2026

Palladium: ⬆️ Buy - Palladium reversed from round support level 1600.00 - Likely to rise…

34 minutes ago

Amazon Wave Analysis – 6 January 2026

Amazon: ⬆️ Buy - Amazon broke resistance zone - Likely to rise to resistance level…

35 minutes ago

Pro News Flash: Gold Bulls Take Control

🥇 Gold is regaining momentum as investors lean into geopolitics, a softer US dollar and…

7 hours ago

The dollar is forced to retreat

• The reduction in geopolitical risks in Venezuela has weakened the greenback. •  Precious metal investors…

10 hours ago

This website uses cookies